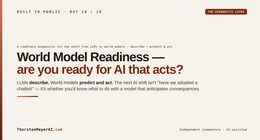

The Post‑Labor Economy, Region by Region
Data from Artificial Intelligence Max https://artificialintelligencemax.com/
Why “beyond‑GDP” indicators—not head‑counts of jobs—will define winners and losers
TL;DR
GDP and unemployment no longer tell the whole story. Track Inclusive Income, CO₂‑adjusted output, Intangible Capital Share, and the Job Quality Index to gauge real prosperity as labor’s role shrinks. The United States, Germany, China, and the EU are moving along very different trajectories on each metric — and the policy choices they make this decade will lock in advantages or hard‑to‑reverse gaps.
1 | From “Full Employment” to “Full Prosperity”
Automation is decoupling human work from economic output faster than most legacy statistics can capture. That is why agencies from the UK’s Office for National Statistics (pioneering Gross Inclusive Income) to the European Commission (championing Job Quality dashboards) are racing to redefine progress.
Four metrics matter most in a post‑labor world:
- Inclusive Income (II) – adds unpaid contributions (care, volunteering) and subtracts social or environmental harm.
- CO₂‑Adjusted Output – rewards growth that happens with fewer emissions.
- Intangible Capital Share – measures how much value comes from software, data, IP, brand, R&D.
- Job Quality Index (JQI) – tracks wage levels, security, hours and satisfaction, not just job counts.
Together they spotlight whether automation is lifting welfare or merely boosting corporate profits while externalizing costs.
AI-powered reskilling training courses
As an affiliate, we earn on qualifying purchases.
As an affiliate, we earn on qualifying purchases.
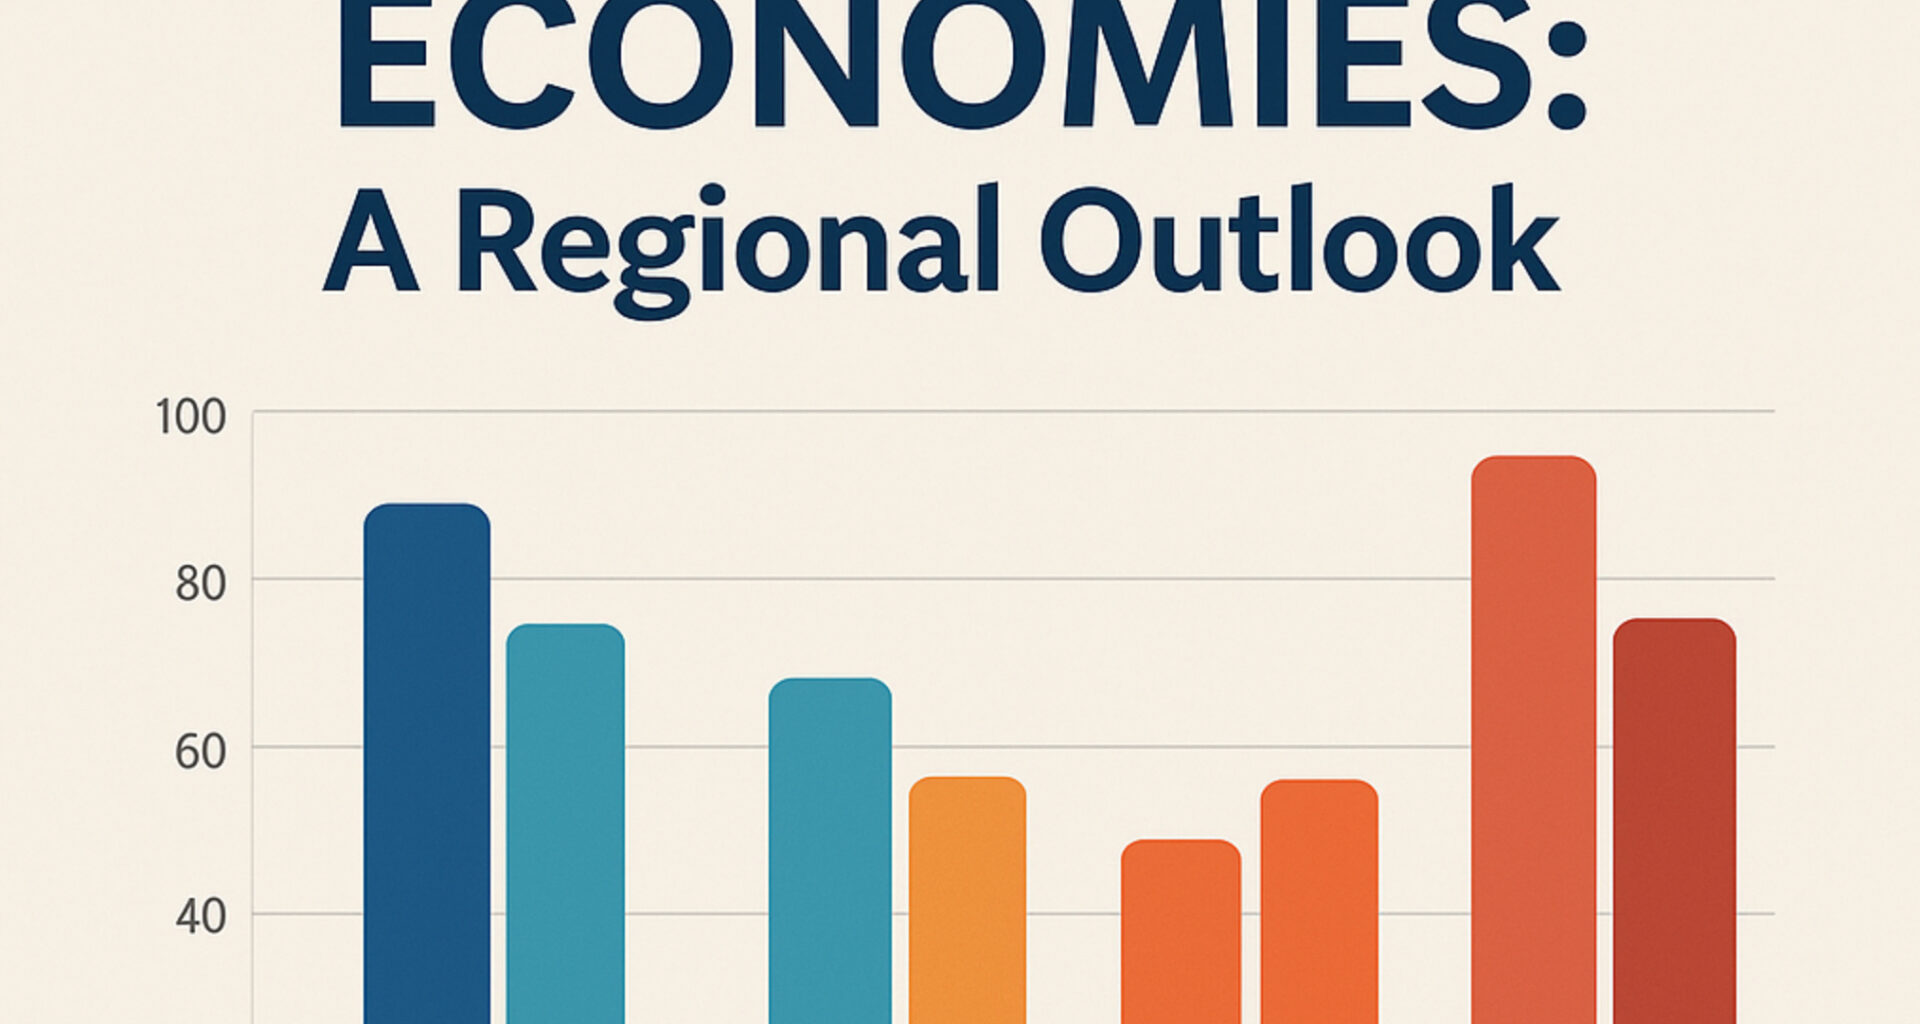
2 | Regional Scorecards at a Glance
| Region | Inclusive Income Trend | CO₂‑Adjusted Output | Intangible Capital Share | Job Quality Index |
| United States | Positive but unequal; middle class squeezed | Improving (coal at 60‑year low) | World leader (> 16 % of GDP) | Low‑80s—skew to low‑wage service jobs |
| Germany | Steady; demographic drag offset by productivity | Rapid decarbonization (coal exit by 2030) | Catching US (~12 % of GDP) | High—collective bargaining cushions shocks |
| China | Rising but volatile; rural‑urban gaps | Peaking emissions by 2030; clean‑tech boom | Growing fast but still lagging efficiency | Polarized; gig‑economy protections emerging |
| European Union | Broad-based; strong social floor | World benchmark (‑55 % vs. 1990 target) | 7–10 %, public‑sector push | Mixed; East–West divergence |
(Data ranges 2022‑2024; sources compiled from IMF, IEA, WIPO, ETUI, national statistics.)

Retirement Planning for Freelancers: Simple Strategies to Build Wealth and Achieve Financial Independence as Self Employed Professionals
As an affiliate, we earn on qualifying purchases.
As an affiliate, we earn on qualifying purchases.
3 | Deep Dives & 2030 Scenarios
3.1 United States — Intangibles Rule, Inequality Looms
- Strategic edge: unmatched R&D spend, AI clusters, deep capital markets.
- Risks: labor‑share could drop below 48 % by 2030 without intervention; JQI stuck < 90.
- Policy playbook: portable benefits for gig workers, refundable lifelong‑learning credits, tax incentives for firms that share productivity gains (e.g., wage floors or employee equity).
3.2 Germany — Automate to Offset Demographics
- Strategic edge: robotics density > 300 per 10k workers; dual apprenticeship system.
- Risks: SME digital lag; truck‑driver job losses from autonomous freight.
- Policy playbook: scale 4‑day‑week pilots, Mittelstand digital grants, green‑hydrogen industrial clusters.
3.3 China — Scale + Speed, But Social Stability Tested
- Strategic edge: largest robotics market; STEM graduate boom; clean‑tech exports now 10 % of GDP.
- Risks: up to 100 M occupational transitions; rural migrants lack safety nets.
- Policy playbook: national re‑skilling fund, gig‑economy minimum standards, “green‑growth” bonds tying automation to decarbonization.
3.4 European Union — Just‑Transition Laboratory
- Strategic edge: strongest decoupling of GDP and emissions; social dialogue culture.
- Risks: energy‑price shocks, East–West skill gaps.
- Policy playbook: EU‑wide skills wallet, cross‑border mobility vouchers, climate‑linked industrial policy (e.g., Net‑Zero Industry Act).
carbon footprint tracking software
As an affiliate, we earn on qualifying purchases.
As an affiliate, we earn on qualifying purchases.
4 | What Leaders Should Do Next
For Policymakers
- Legislate beyond‑GDP dashboards. Publish II, CO₂‑adjusted GDP, JQI alongside headline GDP.
- Tax what you don’t want, subsidize what you do. Carbon pricing plus R&D credits tied to workforce up‑skilling.
- Modernize safety nets. Unemployment insurance → “Income Insurance” that covers gig gaps and learning breaks.
For Corporate Executives
- Treat up‑skilling as cap‑ex, not op‑ex. Budget multiyear reskilling programs on the balance‑sheet.
- Design jobs for augmentation. Automate the rote; up‑level humans to creative, relationship‑rich roles.
- Report “Net‑Zero Profit.” Disclose profits after internal carbon cost and after accounting for wage equity.
For Investors & Civil Society
- Demand intangible governance. Ask boards how they steward data, brand and IP, not just plant & equipment.
- Fund local transition labs. Pilot work‑sharing, community UBI pilots, or civilian “Tech Service” corps.

Harvesting Intangible Assets: Uncover Hidden Revenue in Your Company's Intellectual Property
As an affiliate, we earn on qualifying purchases.
As an affiliate, we earn on qualifying purchases.
5 | Conclusion: Measuring What Matters
The race toward a post‑labor economy is not about hitting the highest robot count. It is about raising Inclusive Income while shrinking carbon and upgrading job quality. Regions that internalize those metrics into everyday decision‑making will turn automation into broad‑based abundance. Those that cling to 20th‑century yardsticks risk a brittle prosperity owned by too few.
Which side of that future we land on is still a policy choice, not a technological destiny.
Enjoyed this analysis?
Get more briefings on AI, economics and policy in your inbox every Friday. Subscribe to the Thorsten Meyer AI newsletter →
Source:The Future of Post‑Labor Economies: A Regional Outlook