
By Thorsten Meyer | ThorstenMeyerAI.com | February 2026
Executive Summary
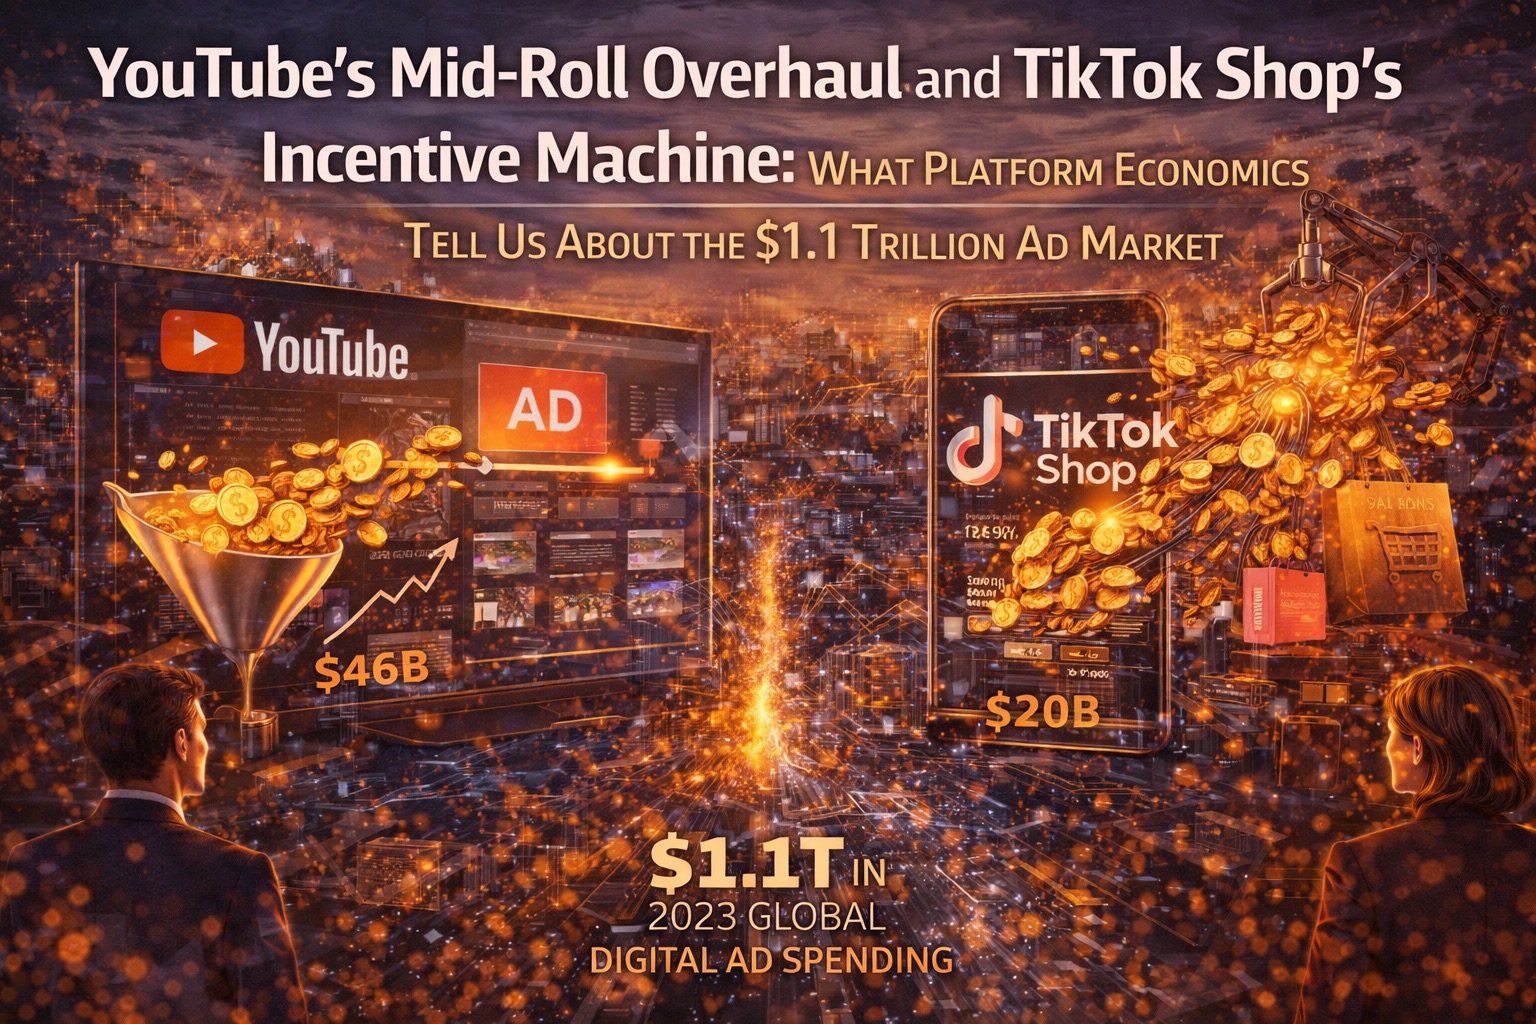
YouTube generated $60 billion in total revenue in 2025 — more than Netflix, more than any entertainment company except Disney. TikTok Shop’s global GMV approached $100 billion in the same year, nearly doubling from 2024. These aren’t just platform stories. They’re structural signals about where the $1.1 trillion global advertising market is heading — and who controls the economics.
Two platform moves from 2025 illustrate the shift. YouTube revamped its mid-roll ad placement system on 12 May 2025, using machine learning to insert ads at natural breakpoints rather than mid-sentence. TikTok Shop launched its NewStar Product Sales Incentive Program in November 2025, paying sellers advertising credits to list new products and achieve early sales traction.
Both moves look tactical. Both are strategic. YouTube is optimizing the attention-to-revenue conversion for long-form content. TikTok is subsidizing supply-side growth to lock merchants into its commerce ecosystem. Together, they reveal a market where platform architecture decisions now matter more than brand media plans — and where the line between advertising and commerce has effectively disappeared.
| Metric | Value |
|---|---|
| YouTube total revenue (2025) | $60 billion |
| YouTube Q4 2025 ad revenue | $11.4 billion |
| YouTube US economic contribution (2024) | $55 billion GDP, 490,000 jobs |
| TikTok Shop global GMV (2025) | ~$100 billion |
| TikTok Shop US GMV (H1 2025) | $5.8 billion (+91% YoY) |
| TikTok US businesses on platform | 7.5 million |
| TikTok US jobs benefiting | 4.7 million |
| Global ad market (2025) | $1.14 trillion |
| Digital share of global ad spend | 73%, rising to 80%+ with CTV |
| US social commerce (2025) | ~$87 billion |
| US social commerce (2026 projected) | $100+ billion |
| Global ad-blocker users | 912 million (projected 1B+ by 2026) |
| US retail media ad spend (2026) | $69.3 billion |
YouTube automatic mid-roll ad placement tools
As an affiliate, we earn on qualifying purchases.
As an affiliate, we earn on qualifying purchases.
1. The Attention-to-Revenue Machine: YouTube’s Mid-Roll Revamp
What Changed
On 12 May 2025, YouTube replaced its legacy mid-roll ad placement system with a machine-learning model that identifies natural breakpoints — scene transitions, topic shifts, pauses — and inserts ads there instead of at arbitrary intervals or mid-sentence. Creators can use a hybrid model combining manual placements with automatic ones. A new feedback tool flags manual placements deemed “interruptive,” reducing their likelihood of serving ads. For videos uploaded before 24 February 2025, YouTube automatically added new ad slots unless creators explicitly opted out.
This isn’t a cosmetic update. It’s a re-architecture of how YouTube converts attention into revenue.
The Revenue Signal
YouTube reported that channels using the hybrid model (manual + automatic placements) saw an average 5% increase in ad revenue. At YouTube’s scale — $36.8 billion in ad revenue alone for 2025, plus roughly $20 billion in subscription revenue — a 5% lift on the ad side represents approximately $1.8 billion in incremental annual ad revenue across the creator ecosystem.
| Metric | Before Revamp | After Revamp |
|---|---|---|
| Ad placement method | Fixed intervals or manual | ML-driven natural breakpoints |
| Creator control | Manual only | Hybrid (manual + automatic) |
| Revenue impact (hybrid users) | Baseline | +5% average |
| Interruptive ad handling | No feedback | Red flag indicator, deprioritized |
| Legacy video treatment | Existing placements | Auto-added unless opt-out |
Q4 2025 confirmed the trajectory: YouTube’s advertising business hit $11.4 billion for the quarter, up 9% year-over-year, driven partly by improved ad experiences attracting holiday-season brand spend. For the full year, Alphabet disclosed YouTube’s total revenue publicly for the first time — a signal of confidence in the platform’s standalone economics.
Why This Matters Beyond YouTube
The mid-roll revamp addresses a market-wide problem. 42.7% of internet users now block ads globally, with the user base projected to exceed 1 billion by 2026. In the US, 32.2% of users run ad blockers. The primary reason: 74% cite intrusive and disruptive ads. Over 91% of consumers say they see too many ads on social media.
YouTube’s bet is straightforward: reduce interruption, reduce ad-blocker motivation, retain viewers longer, and create more total ad inventory through increased watch time — even if individual ad slots are more selectively placed.
| Ad Fatigue Indicator | Statistic |
|---|---|
| Global ad-blocker users | 912 million (1B+ projected 2026) |
| US ad-blocker adoption | 32.2% |
| Primary reason for blocking | 74% cite intrusive/disruptive ads |
| Consumers saying too many social ads | 91% |
| Unsubscribed from brands (past 90 days) | 79% from at least one; 61% from 3+ |
| Americans feeling overlooked by advertisers | 44% |
| Annoyed by cross-platform ad tracking | 67% |
“YouTube isn’t solving an ad-quality problem. It’s solving an economics problem: how to increase ad load without increasing user attrition. The answer is placement intelligence, not placement volume.”
The Creator Economy Ripple
YouTube’s creative ecosystem contributed $55 billion to US GDP in 2024 and supported the equivalent of 490,000 full-time jobs — up $20 billion and 100,000 jobs from 2022. A 5% revenue lift for creators using the hybrid model doesn’t just improve individual channel economics. It increases the attractiveness of content creation as a career path, accelerates investment in production quality, and supports ancillary industries — editing software, production teams, influencer agencies, thumbnail designers.
But the update also creates winners and losers. Channels that relied on manual mid-rolls at fixed intervals — especially those placing ads at interruptive points — face revenue declines as YouTube deprioritizes those placements. Smaller creators without analytics teams are most exposed. Larger channels with dedicated data capabilities were already optimizing placement timing; for them, the automated system confirms what they already knew.
YouTube CEO Neal Mohan framed 2026 as an “inflection point” where the platform will treat creators as studios, expand commerce tools, and scale AI-powered content systems. The mid-roll revamp is the infrastructure that makes that strategy financially viable.

CyberLink PowerDirector 2026 | Video Editing Software for Windows | AI Video Editor, Screen Recorder, Slideshow Maker, Effects & Transitions | YouTube & Content Creation | Box with Download Code
Enhanced Screen Recording – Capture screen & webcam together, export as separate clips, and adjust placement in your…
As an affiliate, we earn on qualifying purchases.
As an affiliate, we earn on qualifying purchases.
2. TikTok Shop’s Subsidy Machine: The NewStar Incentive Economics
The Program Mechanics
TikTok Shop’s NewStar Product Sales Incentive Program ran from 1–30 November 2025 in the US market. It offered two reward tiers:
| Incentive | Qualification | Reward | Cap |
|---|---|---|---|
| New Product Sales | Listed Oct–Nov 2025; ≥1 order; shop score ≥3.5; listing quality Fair/Good; ≥5 images | $15 ad credit per product | $3,000/month per seller |
| Cold-Start | ≥$250 GMV and ≥3 orders; early-bird discount or free sample offered | $55 ad credit per product | $3,000/month per seller |
The design is revealing. Rewards aren’t cash — they’re advertising credits deposited into the seller’s TikTok Ads Manager account. Every incentive dollar gets recycled back into TikTok’s ad revenue. The program doesn’t subsidize sellers. It subsidizes TikTok’s own ad marketplace by giving sellers money they can only spend on TikTok.
The Growth Context
TikTok Shop’s trajectory makes the subsidy economics rational. In H1 2025 alone, US GMV reached $5.8 billion — a 91% year-over-year increase. Globally, GMV approached $100 billion for the full year, nearly doubling from 2024. The number of US shops grew to approximately 475,000, with about 216,000 actively selling. Over 171,000 of those are small businesses, accounting for more than a third of monthly US TikTok Shop transactions.
| TikTok Shop Metric | Value |
|---|---|
| Global GMV (2025) | ~$100 billion |
| US GMV (H1 2025) | $5.8 billion (+91% YoY) |
| US GMV (full-year 2025 est.) | ~$15 billion |
| US active shops | ~216,000 of 475,000 registered |
| US small business sellers | 171,000+ |
| US TikTok buyers (2025) | 53.2 million |
| US TikTok buyers (2026 projected) | 57.7 million |
| Live commerce share of US GMV | 14% (up from 10% in 2024) |
| Shop tab share of US GMV | 36% (up from 32% in 2024) |
TikTok Shop now accounts for nearly 20% of US social commerce, which itself is projected to surpass $100 billion in 2026 — up 18% from 2025. EMARKETER projects TikTok Shop US sales will exceed $20 billion in 2026 and reach $30 billion by 2028.
“TikTok Shop’s NewStar program isn’t a seller incentive. It’s a customer-acquisition cost for TikTok’s advertising business, disguised as a merchant benefit. Every dollar of ad credit is a dollar of ad revenue TikTok books when the seller spends it.”
The Divestiture Factor
The elephant in TikTok’s commerce strategy is the US divestiture. On 22 January 2026, TikTok formally announced the establishment of TikTok USDS Joint Venture LLC — the joint venture that divests US operations from ByteDance. The deal, valued at approximately $14 billion, gives American investors (Oracle, Silver Lake, MGX) majority ownership. ByteDance retains less than 20%. Oracle serves as the designated security partner, managing data audits and replicating the recommendation algorithm under US jurisdiction.
For TikTok Shop sellers, the divestiture resolves the existential regulatory risk that hung over the platform throughout 2024 and 2025. But it introduces new questions:
| Divestiture Impact Area | Pre-Deal Risk | Post-Deal Reality |
|---|---|---|
| Platform availability | US ban possible | Resolved — JV operational |
| Data sovereignty | Chinese access to US data | Oracle manages US data/algorithm |
| Algorithm continuity | Potential degradation if separated | Being replicated under US jurisdiction |
| Seller confidence | Brands hedging to Instagram/YouTube | Uncertainty reduced, not eliminated |
| Regulatory overhead | CFIUS scrutiny, congressional pressure | Ongoing compliance obligations |
The resolution doesn’t eliminate risk — it transforms it. Sellers now face questions about whether the US-jurisdiction algorithm will perform as well as the ByteDance-trained original, whether Oracle’s security layer introduces latency or capability constraints, and whether the JV’s governance structure can sustain TikTok Shop’s aggressive growth trajectory.
creator feedback tools for YouTube ads
As an affiliate, we earn on qualifying purchases.
As an affiliate, we earn on qualifying purchases.
3. The Structural Shift: When Advertising Becomes Commerce
The Convergence Economics
The YouTube and TikTok Shop moves aren’t parallel stories. They’re convergent. YouTube is moving into commerce — CEO Neal Mohan’s 2026 strategy explicitly includes expanding shopping tools for creators. TikTok is moving advertising revenue to the center of its commerce model — the NewStar program’s ad-credit structure makes this explicit. Both platforms are collapsing the distinction between content, advertising, and transaction.
The numbers illustrate the convergence:
| Market Segment | 2025 | 2026 (Projected) | Growth |
|---|---|---|---|
| Global ad market | $1.14 trillion | $1.2 trillion | +5.1% |
| US retail media ad spend | $58.8 billion | $69.3 billion | +17.8% |
| US social commerce | ~$87 billion | $100+ billion | +18% |
| YouTube total revenue | $60 billion | — | +11.7% YoY |
| TikTok Shop global GMV | ~$100 billion | — | +94% YoY |
Retail media is now projected to overtake TV ad spend in 2026 globally, reaching $196.7 billion — 16% of all advertising investment. Amazon alone will account for nearly $70 billion in retail media ad revenue. This is the context in which YouTube and TikTok are competing: not just for eyeballs, but for the transaction that follows the eyeball.
The Consumer Squeeze
Both platforms’ moves carry implications for consumer welfare that are systematically underweighted in industry analysis.
YouTube’s upside for consumers is real. Natural-breakpoint placement reduces the interruption that drives 74% of ad-blocker adoption. If it keeps more content free and ad-supported, it reduces pressure toward subscription paywalls.
TikTok Shop’s consumer impact is more ambiguous. The platform’s algorithm merges entertainment with commerce, driving unplanned purchases. 71% of TikTok users have purchased items they discovered in their feed. Holiday shopping intent among US TikTok users rose from 76.1% in 2024 to 83.2% in 2025. The NewStar program expands product selection and may deliver early-bird discounts, but it also accelerates the “scroll-to-spend” dynamic that pushes impulse purchases — especially among younger demographics with less financial resilience.
| Consumer Impact | YouTube Mid-Roll Revamp | TikTok Shop NewStar |
|---|---|---|
| Ad experience | Less intrusive, natural breaks | More product exposure in feeds |
| Content access | Supports free ad-supported model | Subsidizes seller discounts |
| Purchase pressure | Indirect (ad-supported content) | Direct (in-feed commerce) |
| Privacy concern | Watch-pattern data for ad targeting | Purchase + behavior data integration |
| Impulse-buying risk | Low | High — 71% buy from feed discovery |
Around 9 in 10 Americans worry about rising living costs. In that context, platforms that reduce friction to spending aren’t neutral actors. They’re shaping consumption patterns at population scale.
“The consumer case for YouTube’s mid-roll revamp is straightforward: less interruption, more free content. The consumer case for TikTok Shop’s incentive programs is murkier: more choices, more discounts — and more algorithmic pressure to buy things you didn’t know you wanted.”
social commerce seller incentives
As an affiliate, we earn on qualifying purchases.
As an affiliate, we earn on qualifying purchases.
4. Competitive Implications: Who Wins, Who Adapts
Platform Positioning
YouTube and TikTok aren’t the only players responding to these structural shifts. The competitive landscape is reshaping around three axes: ad-experience quality, commerce integration, and data architecture.
| Platform | Ad Strategy | Commerce Strategy | Data Advantage |
|---|---|---|---|
| YouTube | ML-driven natural breakpoints | Expanding creator shopping tools | Watch patterns + Google ecosystem |
| TikTok Shop | In-feed product ads + ad credits | Full marketplace with FBT fulfillment | Purchase + behavior + interest graph |
| Amazon | Retail media dominant ($60B+) | Native marketplace | Purchase history + Prime data |
| Meta (Instagram) | Reels ads, shopping features | Instagram Shop (scaled back) | Social graph + engagement |
| Walmart | Growing retail media network | Walmart.com + marketplace | Transaction + location data |
Amazon and Walmart will capture 89% of incremental US retail media spend in 2026. That’s the real competitive constraint on TikTok Shop: it’s not competing with Instagram for social commerce dollars. It’s competing with Amazon for the transaction and the ad revenue that surrounds it.
What Brands and Agencies Should Do
1. Audit platform concentration risk. If more than 40% of your digital ad spend flows through a single platform, you’re not buying media — you’re buying dependency. Map revenue attribution by platform and test diminishing returns.
2. Evaluate YouTube’s hybrid model for creator partnerships. Brands sponsoring YouTube creators should understand how the mid-roll revamp affects ad adjacency and viewer attention. Natural breakpoints may increase ad recall; interruptive placements being deprioritized may reduce inventory on some channels.
3. Stress-test TikTok Shop economics post-divestiture. The JV structure resolves the ban risk but introduces uncertainty about algorithm performance, data access, and seller tools evolution. Brands with significant TikTok Shop revenue should model scenarios where US algorithm performance diverges from the global platform.
4. Build first-party data capabilities. The demise of third-party cookies continues. Platforms with rich first-party data — YouTube’s watch patterns, TikTok’s purchase behavior, Amazon’s transaction history — command pricing power. Brands that build their own first-party data reduce platform leverage.
5. Integrate social commerce into media planning, not as an experiment. US social commerce will exceed $100 billion in 2026. That’s not a pilot program. Brands still treating TikTok Shop or YouTube Shopping as experimental channels are misallocating resources.
5. The Economic Footprint: Jobs, GDP, and the Platform Dependency Question
The Numbers Are Large — and Concentrated
The economic contribution of these platforms is substantial but raises concentration questions.
| Platform | US Economic Contribution | Jobs Supported | Revenue Base |
|---|---|---|---|
| YouTube | $55 billion GDP (2024) | 490,000 FTE | $60 billion total (2025) |
| TikTok | $24.2 billion GDP (2023) | 4.7 million benefit | ~$15 billion US GMV (2025) |
| Combined platform ad market | — | — | $1.14 trillion global (2025) |
YouTube supports nearly half a million full-time-equivalent jobs in the US and contributed $55 billion to GDP in 2024. TikTok claims 7.5 million US businesses on its platform, with 4.7 million jobs benefiting — including 3.1 million using TikTok directly in their work. 74% of US businesses on TikTok say the platform helped them increase sales, expand locations, or hire more workers.
These are real economic contributions. They’re also real economic dependencies. When a platform changes its algorithm, its ad-placement rules, or its seller incentive structure, the downstream impact flows through millions of small businesses and creators who have limited ability to diversify.
The Small Business Paradox
TikTok Shop’s appeal to small businesses is genuine. Over 171,000 small businesses are active on the platform, with sales growing 70% year-over-year. The NewStar program specifically targets smaller sellers with lower thresholds ($250 GMV for cold-start incentives).
But platform dependency for small businesses creates fragility. When TikTok faced a potential US ban throughout 2024–2025, brands hedged by shifting spend to Instagram and YouTube. Small sellers couldn’t hedge the same way — they lacked the resources, the audience portability, and the multi-channel infrastructure. The divestiture resolved the immediate ban risk, but it illustrated a structural vulnerability: small businesses on platforms are tenants, not owners. The landlord sets the rules.
“7.5 million businesses on TikTok and 490,000 YouTube-supported jobs sound like economic vitality. They are. They’re also economic concentration — and the difference between vitality and fragility depends entirely on what the platform decides to do next quarter.”
The Bottom Line
YouTube’s mid-roll revamp and TikTok Shop’s NewStar program are small moves with structural implications. YouTube is proving that better ad placement — not more ad placement — drives revenue growth at scale. TikTok is proving that subsidizing seller growth with ad credits creates a self-reinforcing commerce-and-advertising flywheel.
The broader signal is more important than either initiative alone. The $1.14 trillion advertising market is reorganizing around platforms that combine content, commerce, and data in integrated loops. Retail media is overtaking television. Social commerce is crossing $100 billion. The creators, sellers, and small businesses building on these platforms are generating real economic value — while accepting real economic dependency.
For brands: the question isn’t where to place your next ad. It’s how much platform dependency your business model can absorb — and what happens when the platform changes the rules.
The most important ad placement isn’t the one that converts. It’s the one you can still run when the platform rewrites its algorithm.
Thorsten Meyer is an AI strategy advisor who reads Alphabet earnings calls the way some people read movie reviews — for the plot twists in the footnotes. More at ThorstenMeyerAI.com.
Sources:
- Variety — YouTube Revenue for Full-Year 2025 Topped $60 Billion (February 2026)
- Alphabet — Q4 and Fiscal Year 2025 Earnings Release (February 2026)
- Shacknews — YouTube Ad Revenue Q4 2025: $11.383 Billion (February 2026)
- Social Media Today — YouTube Updates Mid-Roll Ad Placement Process (2025)
- Birdeye — Better Breaks, Bigger Bucks: YouTube’s Mid-Roll Ads Update (2025)
- EMARKETER — YouTube Mid-Roll Ad Revenue Lift Data (2025)
- Search Engine Journal — YouTube Mid-Roll Hybrid Model Details (2025)
- YouTube Blog — Mid-Roll Ads Updates Explained (2025)
- TechCrunch — YouTube Ecosystem Created 490K Jobs, Added $55B to US GDP (2025)
- Oxford Economics — YouTube’s Creator Economy Impact Report (2024)
- TikTok Seller Center — November 2025 NewStar Product Sales Incentive Program
- Digiday — Inside TikTok Shop’s Incentives for the 2025 Holiday Period (2025)
- Momentum Works — TikTok Shop Doubles Global GMV in H1 2025, US Hits $5.8B (2025)
- Jiemian Global — TikTok Shop GMV Nears $100 Billion in 2025 (2025)
- EMARKETER — TikTok Shop Makes Up Nearly 20% of Social Commerce in 2025
- Retail Dive — TikTok Shop Is Driving Social Commerce Growth (2025)
- AfterShip — TikTok Shop Statistics in 2026
- Oxford Economics — TikTok US Economic Impact: 7.5M Businesses, 4.7M Jobs (2025)
- Forrester — US TikTok Set to Divest in 2026 (2026)
- Fox Business — TikTok Reaches Agreements on New US Joint Venture (2026)
- WPP Media — Global Ad Revenue $1.14 Trillion in 2025 (December 2025)
- Dentsu — Global Ad Spend Set to Surpass $1 Trillion in 2026
- EMARKETER — Retail Media Ad Spending Forecast 2025–2026
- EMARKETER — Amazon Retail Media Ad Revenues Will Pass $60 Billion (2025)
- Cropink — Ad Blockers Usage Statistics 2026
- Backlinko — Ad Blocker Usage and Demographic Statistics 2026
- Blogging Wizard — 29 Social Commerce Statistics & Trends for 2026
- Netinfluencer — YouTube CEO Outlines 2026 Push for Creator Studios (2026)
- Stack Influence — TikTok User Purchase Behavior Statistics (2025)
- AdMonsters — Consumer Ad Fatigue Survey Data (2025)