
By Thorsten Meyer — May 2026
April 29, 2026. The Big Four hyperscalers — Microsoft, Amazon, Alphabet, Meta — released earnings within the same 24-hour window. The combined message on AI capital expenditure for calendar 2026 came in at approximately $725 billion combined, raised from the high-end consensus estimate of $670 billion that markets had carried into the print. Microsoft at $190B. Amazon at $200B. Alphabet at $185B. Meta at $125-145B (raised $10B at both ends). Plus Oracle and the second-tier hyperscalers, the global picture climbs toward $740 billion per Morgan Stanley research. The aggregate represents a 69 percent year-over-year increase over 2025 levels and the largest capital-expenditure cycle in modern corporate history.
NVIDIA, in the typical narrative arc, should be the unambiguous winner. The hyperscaler capex flows substantially through NVIDIA-supplied GPUs and networking. Q4 fiscal 2026 NVIDIA data center revenue was $62.31 billion, up 75 percent year-over-year; networking revenue up 263 percent. Full-year FY26 data center revenue at $193.7 billion. Yet NVIDIA’s stock fell sharply after the hyperscaler earnings rather than rallying. The reason: the market began questioning whether GPUs are still the binding constraint in AI deployment, or whether the binding constraint has shifted to power, cooling, hyperscaler in-house silicon (Google TPU, Amazon Trainium/Graviton), or revenue translation from the existing capex into actual operating-line growth.
This dispatch is the read on the Big Four print and the structural questions the capex number raises but doesn’t answer. The point is not to predict NVIDIA’s stock direction — it is to map the structural questions that will determine whether the $725B 2026 capex translates into the revenue and earnings growth the market is implicitly pricing in, or whether 2027-2028 produces a meaningful impairment cycle as 6-year depreciation assumptions meet revenue reality.
The dispatch on the compute concentration audit covered the structural concentration of AI compute among AWS, Azure, GCP. The dispatch on the Anthropic IPO disclosure document covered the S-1 risk factors that connect to compute economics. The dispatch on the China Sphere capability gap covered the cost dynamics that compress AI pricing. Q1 2026 hyperscaler capex sits at the intersection of all three: the largest capital deployment in tech history, funding the infrastructure that supports the frontier-lab API revenue, against compressing pricing dynamics that may not justify the spend.
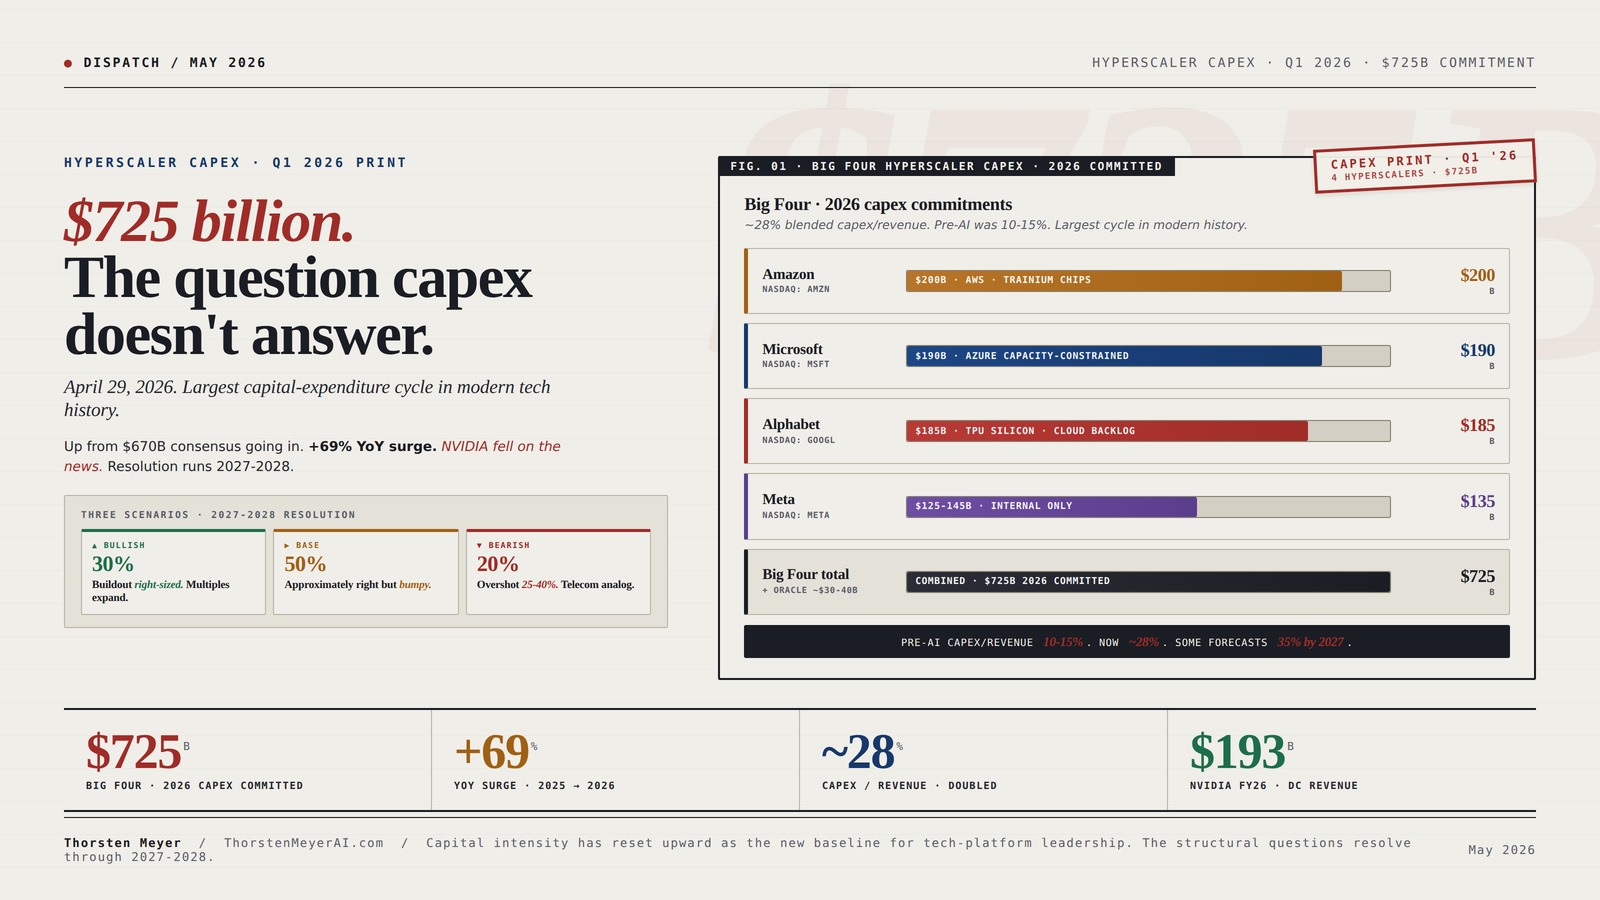
$725 billion. The question capex doesn’t answer.
April 29, 2026. Largest capital-expenditure cycle in modern tech history. Lock-in across the Big Four.
Microsoft $190B. Amazon $200B. Alphabet $185B. Meta $125-145B. Up from $670B high-end consensus going in. +69% YoY surge over 2025. NVIDIA fell on the news. The structural questions — depreciation, power, in-house silicon, demand-pull, geopolitical — resolve through 2027-2028.
Four hyperscalers. $725B committed.
Each hyperscaler beat-and-raised in the same 24-hour window April 29. Microsoft / Amazon / Alphabet / Meta. The capex commitment is non-discretionary at this scale — companies cannot back out without creating asset write-downs and capacity gaps.

VISION COMPUTERS, INC. PNY RTX H100 NVL – 94GB HBM3-350-400W – PNY Bulk Packaging and Accessories
The H100 NVL graphics card is designed to scale the support of large language models, such as GPT3-175B,…
As an affiliate, we earn on qualifying purchases.
As an affiliate, we earn on qualifying purchases.
Three paths. One question.
The capex buildout resolves through one of three structural paths. The honest assessment: the demand signals are real, the supply signals are real, and the balance between them is the structural question.
- Demand +60-100% YoYEnterprise translates fully.
- Utilization 85%+NVIDIA pricing power holds.
- $2.8T by 2028Jensen trajectory matches.
- No impairmentCapex fully accretive.
- Outcome: Multiples expand. Foundation for next decade.
- Demand +30-60% YoYPartial translation.
- Utilization 75-85%Weaker pockets visible.
- NVDA decel 75% → 30-50%Manageable adjustment.
- $30-80B impairmentLimited 2028 cycles.
- Outcome: Multiples compress modestly. No crisis.
- Demand +15-30% YoYEnterprise falls short.
- Utilization 65-75%Capacity glut visible.
- $150-300B impairmentBig Four 2027-2028.
- NVDA sharp decelPricing compression.
- Outcome: 30-50% multiple compression. Post-2001 telecom analog.

Two Channel SXM2 Expansion Board Builts for Data Center GPUs Featuring Advanced 300G Cooling Solution Servers GPU Accelerators Board
Engineered for, the SXM2 two GPU expansion baseboard 300G supports two SXM2 GPUs ( V100) with integrated NVLink…
As an affiliate, we earn on qualifying purchases.
As an affiliate, we earn on qualifying purchases.
Five vectors. Interdependent.
Capital-allocation risks of this magnitude resolve through specific structural channels. The vectors are not independent — power constraints delay deployment which compresses utilization which triggers impairment.
Capital intensity has reset upward as the new baseline for tech-platform leadership. The competitive moat is partly capital availability rather than purely product or technology innovation. Tech-platform leadership now requires capital-deployment scale that fewer companies can execute.
hyperscaler data center networking equipment
As an affiliate, we earn on qualifying purchases.
As an affiliate, we earn on qualifying purchases.
Four assignments. By role.
Reset on structural pricing-power compression.
Bull case requires NVIDIA to maintain addressable share through FY27-FY28; in-house silicon migration argues that share compresses. Position accordingly. Consider AMD, Broadcom, downstream networking suppliers as partial substitutes that may benefit from compression. Stop pricing the $2.8T-by-2028 ceiling literally.
Treat capex as tailwind and risk factor.
Microsoft best-positioned through capacity-constrained Azure demand. Alphabet best-positioned through TPU silicon independence. Amazon best-positioned through Trainium/Inferentia revenue diversification. Meta most exposed through internal-product-only revenue offset. Position differentially rather than treating Big Four as equivalent.
Use the buildout to negotiate.
Capacity becoming abundant; pricing under structural pressure. 2-3 year contracts with capacity guarantees + price-discount escalators that capture unit-cost reduction as buildout absorbs. Multi-cloud sourcing more attractive as capacity scarcity ends. The negotiating window opens through 2026-2027.
Plan for capacity glut by H2 2027.
Capex commitment produces more compute than current demand absorbs at current pricing. API pricing pressure compounds through 2027-2028. China sphere cost gap (5-30× cheaper) makes more acute. Margin guidance for next 18 months should explicitly model capacity-driven price compression. Hedge accordingly in S-1 disclosures.
Amazon Trainium AI chips
As an affiliate, we earn on qualifying purchases.
As an affiliate, we earn on qualifying purchases.
Executive Summary · The Capex Picture in One Table
| Hyperscaler | 2026 capex commitment | YoY growth | Capex / revenue | What was disclosed |
|---|---|---|---|---|
| Amazon | $200B | +30%+ | ~25% | Quarterly $44.2B; AWS +28%; chip business $20B run rate |
| Microsoft | $190B | +60%+ | ~28% | Q3 fiscal $30.88B (+84% YoY); AI revenue $37B run rate |
| Alphabet | $185B | +90%+ | ~30% | Q1 $35.67B (>2× YoY); Google Cloud backlog $460B+ |
| Meta | $125-145B | +35-50% | ~30% | Raised $10B at both ends; cited component pricing |
| Oracle (est.) | ~$30-40B | +25-40% | ~25% | Discrete from Big Four, smaller scale |
| Combined Big Four | $700-725B | +69% YoY | ~28% blended | Largest capex cycle in modern history |
| Plus second tier (Tencent, Alibaba, Bytedance, Coreweave, Lambda, Crusoe) | ~$80-120B | Variable | Variable | Less disclosed |
| Global AI infrastructure capex (Morgan Stanley) | ~$740B | +69% YoY | — | All-source aggregate |
The pattern is structurally significant. Capex as a percentage of revenue at the Big Four has approximately doubled from the pre-AI baseline of 10-15 percent to the current 25-30 percent range. Some forecasts project capex/revenue ratios climbing to 35 percent in 2027. The hyperscalers are now outspending their free cash flow and raising debt to fund the buildout — Microsoft, Amazon, and Alphabet have all increased debt issuance since Q1. The capex commitment is not a discretionary investment that can be rolled back if revenue disappoints; it is a structural commitment that locks the companies into the AI buildout regardless of near-term ROI.
1. The Big Four print · what just happened
Each of the four hyperscalers delivered a beat on the headline numbers and a capex-raise on the forward guidance.
Microsoft (Fiscal Q3 2026, reported April 29). Revenue beat consensus. AI annual run-rate revenue surpassed $37 billion. Q3 fiscal capex of $30.88 billion, up 84 percent year-over-year. Full calendar year 2026 capex guidance: approximately $190 billion, with significant share allocated to GPUs and CPUs. Satya Nadella’s commentary emphasized continued capacity-constrained demand — Microsoft cannot deploy capacity fast enough to meet the AI-workload demand from enterprise customers. The Azure AI revenue line is growing faster than Microsoft can build out the underlying compute.
Amazon (Q1 2026, reported April 29). AWS revenue grew 28 percent year-over-year. Q1 capex of $44.2 billion. Amazon’s chip business (Trainium for training, Inferentia for inference, Graviton for general compute) hit a $20 billion revenue run rate. Andy Jassy reaffirmed the $200B 2026 capex guidance from January, saying the plan “remains largely unchanged.” The Trainium ramp is the most consequential structural detail — Amazon is materially shifting AI workloads to in-house silicon, which over time reduces dependency on NVIDIA at the margin.
Alphabet (Q1 2026, reported April 29). Q1 capex of $35.67 billion, more than doubling year-over-year. Google Cloud backlog jumped to over $460 billion. 2026 full-year capex guidance: approximately $185 billion. Alphabet’s positioning is bifurcated: Gemini 3.1 Pro on the model side, TPU v6 on the silicon side, Vertex AI on the developer-platform side. The TPU strategy is the structural differentiator — Alphabet is the only Big Four hyperscaler that has been running custom AI silicon at meaningful scale for over a decade, and the TPU v6 ramp through 2026 will determine how much of Alphabet’s compute can be served without NVIDIA dependence.
Meta (Q1 2026, reported April 29). Raised 2026 capex guidance to $125-145B from prior $115-135B — $10 billion at both ends. Cited “higher component pricing and additional data center costs” as the primary driver. Mark Zuckerberg’s commentary emphasized AI infrastructure as the foundation for the next decade of Meta product evolution, including AR/VR and generative AI integrated across the Family of Apps. Meta does not have a public cloud business; the entire capex spend is to support internal product surfaces. The implication: Meta’s capex/revenue ratio is more aggressive in proportional terms than the cloud-business hyperscalers because Meta has no external revenue offset for the AI infrastructure spend.
The cumulative beat-and-raise across four companies in the same 24-hour window is structurally rare. The market interpretation: AI demand is real, capacity is constrained, and the capex commitments are durable. The market reaction (NVIDIA selling off, hyperscalers mostly flat-to-down): the durability of the capex commitments is now perceived as a risk factor as well as a tailwind, depending on whether revenue translation materializes.
2. NVIDIA’s paradoxical position
NVIDIA’s stock fell after the hyperscaler earnings despite being the obvious capex beneficiary. The fall is the structural fact that requires explanation.
Reason 1 · GPUs may no longer be the binding constraint. The earlier AI-build narrative positioned GPU availability as the constraint. Hyperscalers couldn’t deploy AI capacity fast enough because they couldn’t get enough NVIDIA H100s and now B100/B200/Blackwells. The recent narrative shift: the binding constraint has moved to power (data center electricity provisioning), cooling (high-density rack cooling), and revenue translation (whether the deployed compute generates proportional revenue). If GPUs are no longer the binding constraint, NVIDIA’s pricing power compresses. The Sherwood News framing: “GPUs simply aren’t the key missing ingredient in the AI boom right now.”
Reason 2 · Hyperscaler in-house silicon is scaling. Google TPU has been at production scale for years. Amazon’s Trainium and Inferentia are at $20 billion revenue run rate. Microsoft’s Maia 100 chip and Cobalt CPU are deployed at increasing scale. Meta’s MTIA accelerator is in production. The combined effect: a meaningful share of hyperscaler AI workload is now running on custom silicon rather than NVIDIA GPUs. The percentage is small at the inference tier and growing at the training tier; over 2027-2028, the in-house share grows further. NVIDIA’s addressable market is not the entire hyperscaler capex; it is the share that doesn’t migrate to in-house silicon.
Reason 3 · The CUDA moat is real but compressing. NVIDIA’s CUDA platform has been the durable moat — switching software stacks is expensive enough that hyperscalers have continued to buy NVIDIA hardware even when in-house alternatives existed. Through 2025-2026, the CUDA moat is gradually eroding through PyTorch/JAX abstraction layers, ROCm (AMD), and hyperscaler-specific software stacks (Google JAX-on-TPU, Amazon Neuron-on-Trainium). The compression is slow but structural. NVIDIA’s pricing power on the next-generation Blackwell and Rubin GPU cycles depends on how slowly the moat compresses.
Reason 4 · The capex absorption question. The $725B 2026 capex represents an enormous commitment of capital. The market is now asking whether the commitment was sized correctly. If the buildout is overbuilt by 15-25 percent (which is plausible given the speed of commitment), 2027-2028 produces capacity utilization below the 80-85 percent threshold that justifies the depreciation schedule. The over-build risk is structurally borne by the hyperscalers (their assets), but it ripples back to NVIDIA through reduced future order flow.
Reason 5 · Jensen Huang’s $2.8T projection became a Rorschach test. In February 2026, Jensen Huang projected that hyperscaler capex doubling annually would produce $2.8 trillion in spending by 2028 and $5.6 trillion by 2029. The projection is consistent with current trajectory but also functions as the bullish-case ceiling. Investors who took the projection literally pushed NVIDIA stock higher in February-March; investors who began discounting the projection’s assumptions through April-May are now selling. The stock action is partly a re-rating of the bullish ceiling rather than the central case.
The cumulative implication: NVIDIA remains the dominant beneficiary of the capex cycle in absolute dollar terms, but the marginal dollar of capex is increasingly likely to flow to non-NVIDIA suppliers (in-house silicon, AMD, networking-specific suppliers, power-and-cooling infrastructure) rather than to incremental NVIDIA GPU purchases. The stock action reflects this structural shift.
3. The question capex doesn’t answer · revenue translation
The headline number — $725B — is dramatic. The structural question that capex doesn’t answer is whether the spend translates into proportional revenue and earnings growth.
The math problem. $725B in capex at a 6-year depreciation schedule produces approximately $120B per year in depreciation expense once the buildout is fully deployed (2027-2028). To justify the depreciation, the AI-driven incremental revenue needs to be substantially higher than $120B/year — typical industry standards require 3-5× depreciation for the capex to be value-accretive. So the AI revenue needs to be growing toward $360-600B per year of incremental revenue specifically attributable to the buildout. Microsoft’s $37B AI run rate is a fraction of that. Amazon’s AWS AI-attributable revenue is similar fraction. The aggregate AI revenue across the Big Four is meaningfully below the threshold required for the capex to be fully accretive.
The Stanford evaluation framing. The Stanford AI Index 2026 (covered in the audit dispatch) argued that 2026 is a “year of evaluation” — the year when the AI investment thesis gets tested empirically. The capex commitment makes the framing concrete. The hyperscalers cannot back out of their 2026 commitments; they are locked in. The question is whether 2027-2028 produces revenue growth that justifies the lock-in or produces a meaningful impairment cycle when the capex is depreciated against insufficient revenue.
The depreciation accounting risk. Hyperscalers have historically used 6-year depreciation schedules for AI infrastructure. The choice of 6-year (vs. 4-year for traditional servers) has been a strategic decision that reduces near-term depreciation expense and supports operating margin. If utilization rates fall below the 80-85 percent threshold or if AI revenue growth disappoints relative to capex, the hyperscalers may need to write down the assets and recognize impairment charges. Impairment cycles compress earnings dramatically and produce stock-multiple compression that exceeds the underlying earnings impact.
The NVIDIA capacity concentration risk. A meaningful share of the $725B is concentrated in NVIDIA hardware purchases. If NVIDIA’s pricing power compresses (which the post-earnings stock action suggests is starting), the same dollar spend produces less compute capacity over time. The hyperscalers benefit from NVIDIA pricing compression in the short term (more compute per dollar) but face the structural question of whether the compute they’re deploying is the architecture they’ll need in 2027-2029 (NVIDIA Blackwell + Rubin) or whether the next architecture (Vera Rubin Ultra, Feynman) makes the current generation obsolete faster than depreciation assumes.
The application demand risk. The capex assumes AI application demand grows proportionally. Through Q1 2026, the demand is real — Microsoft’s “capacity-constrained” framing, AWS’s 28% growth, Google Cloud’s $460B backlog all indicate genuine demand pull. The risk: enterprise AI deployments that have been signed in 2025-2026 may not produce the production usage that justifies the deployed compute. The Stanford AI Index audit covered the FMTI corporate transparency drop (FMTI 58 → 40 YoY) — companies are committing to AI but not consistently delivering the operational deployment that justifies the spend.
The cumulative picture: the $725B capex is not unambiguously good for any of the involved parties. It is good for NVIDIA in absolute dollar terms but compressing in structural pricing power. It is good for hyperscalers in revenue-growth optics but creates 2027-2028 impairment risk. It is good for AI labs (Anthropic, OpenAI) in API capacity availability but creates pricing pressure as capacity comes online faster than demand. The question capex doesn’t answer is which of these directions resolves first.
4. The structural risks · five vectors
Capital-allocation risks of this magnitude resolve through specific structural channels. Five vectors are visible in the Q1 2026 print.
Risk 1 · Depreciation impairment cycle 2027-2028. If utilization drops below 80 percent, hyperscalers may recognize impairment charges. The accounting precedent: telecom companies recognized substantial impairment charges in 2001-2003 after the fiber buildout overshot demand. If AI buildout follows a similar pattern, 2027-2028 produces $50-150B in aggregate impairment charges across the Big Four, compressing reported earnings by 15-30 percent in the affected quarters. Stock-multiple compression typically exceeds the earnings compression.
Risk 2 · Power-grid constraint. AI data centers require 30-100 MW each at production scale. The combined buildout requires power capacity that exceeds current grid availability in primary markets (Northern Virginia, Phoenix, Dublin, Singapore). Grid expansion takes 4-8 years from approval to deployment. The implication: even if the capex is committed, deployment may be delayed by 12-24 months as power-and-cooling infrastructure comes online. Delayed deployment compounds the depreciation risk because depreciation begins when assets are placed in service; delays compress the productive life relative to the depreciation schedule.
Risk 3 · In-house silicon migration. Google TPU, Amazon Trainium, Microsoft Maia, Meta MTIA. Each hyperscaler is scaling custom silicon for AI workloads. The migration percentage is approximately 15-25 percent of inference workload as of Q1 2026, with training still dominantly NVIDIA-based. Through 2027-2028, the migration percentage grows to 30-45 percent. The implication for NVIDIA: the addressable share of hyperscaler capex compresses faster than the absolute spend grows. NVIDIA’s revenue growth rate decelerates even as hyperscaler capex grows.
Risk 4 · Demand-pull failure. The capex assumes enterprise AI deployment grows in line with capacity. If enterprise AI demand stalls (because the operational deployment falls short of expectations, because economic conditions weaken, or because the “year of evaluation” produces negative ROI conclusions), the capacity utilization ratio falls and triggers impairment. The Q3 2026 SaaS earnings pre-brief covered the per-seat-to-consumption transition that is one mechanism for demand-pull translation; if that transition stalls, the underlying capex utilization stalls in parallel.
Risk 5 · Geopolitical / regulatory disruption. US export restrictions on advanced GPUs to China have already constrained NVIDIA’s China business. Further restrictions could constrain hardware deployment in additional jurisdictions. EU AI Act enforcement (covered in the EU AI Sovereignty dispatch) creates compliance overhead that affects deployment economics. Trade-policy disruption between US, Europe, and China could fragment the global AI infrastructure market in ways that reduce returns on the unified-buildout assumption underlying current capex.
The five risks are not independent. Power constraints delay deployment, which compresses utilization, which triggers impairment. In-house silicon migration reduces NVIDIA addressable market, which pressures NVIDIA pricing, which reduces the per-dollar compute available, which affects deployment timelines. The risk vectors interact, and the worst-case scenario is one where multiple risks compound through 2027-2028.
5. The strategic implications by stakeholder
The $725B capex picture has direct consequences for five distinct stakeholder groups.
For NVIDIA investors. The post-earnings sell-off reflects rational repricing of the structural questions above. The bull case (Jensen’s $2.8T-by-2028 trajectory) requires hyperscalers to maintain or accelerate capex while NVIDIA holds its addressable share. The bear case requires hyperscalers to maintain capex while NVIDIA’s addressable share compresses through in-house silicon migration. The base case probably falls in between: NVIDIA continues to grow but at decelerating rates, with revenue growth in 2027-2028 that is meaningfully below the 75 percent year-over-year rate of FY26. Position accordingly.
For hyperscaler investors. The $725B capex commitment represents the largest non-discretionary capital obligation in tech history. The companies cannot back out without creating asset write-downs and capacity gaps. The investment thesis is binary: either AI revenue growth materializes proportionally (bullish) or 2027-2028 produces impairment cycles (bearish). The middle-case is range-bound multiples through 2026-2027 as the market waits for 2027 utilization data. Microsoft is best-positioned through Azure capacity-constrained demand. Alphabet is best-positioned through TPU silicon independence. Amazon is best-positioned through Trainium/Inferentia revenue diversification. Meta is most exposed through internal-product-only revenue offset.
For AI labs (Anthropic, OpenAI, others). The $725B capex creates more compute capacity over 2026-2027 than the labs can absorb at current revenue scale. The implication: API pricing comes under structural pressure as capacity comes online faster than demand. The China sphere cost gap (covered in the Q2 update) compounds this — Chinese frontier labs are pricing 5-30× cheaper, and Western frontier-tier labs face capacity-induced pricing pressure plus competitive pressure simultaneously. The Anthropic IPO disclosure dispatch flagged margin compression as a forward-risk factor; the $725B capex makes this risk more concrete.
For enterprise customers. Capacity availability is the immediate consequence. Through 2026-2027, AI workload capacity becomes more abundant, latency drops, and pricing comes under structural pressure as hyperscalers compete for utilization. Multi-cloud sourcing becomes more attractive because capacity is no longer scarce in any single hyperscaler. Negotiating leverage shifts toward customers as the buildout completes. The optimal customer strategy: 2-3 year contracts with capacity guarantees + price-discount escalators that capture the unit-cost reduction as the buildout absorbs.
For policymakers and regulators. The $725B capex represents capital intensity that has implications for market structure (concentration of compute in 4-5 companies), employment (data centers create few permanent jobs but require substantial construction labor), energy policy (the buildout drives material increases in electricity demand), and national security (compute concentration creates strategic dependencies). The EU AI Act and US executive orders on AI safety provide some regulatory framework; the capex scale suggests additional regulation around grid impact, market concentration, and depreciation accounting will emerge through 2027-2028.
6. Three scenarios for resolution
The capex buildout resolves through one of three structural paths. Each has different probability and different implications.
Bullish scenario · 30% probability · “The buildout was right-sized.” AI demand grows 60-100 percent annually through 2027-2028. Enterprise deployment translates to genuine production usage. Capacity utilization holds at 85+ percent. NVIDIA’s pricing power holds. Hyperscaler revenue growth justifies the capex. No meaningful impairment cycle. The $725B 2026 capex grows to $1.0-1.3T in 2027 and $1.3-1.8T in 2028. The trajectory matches Jensen’s $2.8T-by-2028 projection. Stock multiples on NVIDIA and hyperscalers expand. The capex cycle becomes the foundation of the next decade of tech infrastructure, comparable to the cloud buildout of 2010-2018 in structural significance.
Base scenario · 50% probability · “The buildout was approximately right but bumpy.” AI demand grows 30-60 percent annually through 2027. Enterprise deployment translates partially. Capacity utilization holds at 75-85 percent through 2027 with weaker pockets. Some impairment cycles in 2028 but limited in scope ($30-80B aggregate, manageable). NVIDIA growth decelerates from 75 percent YoY (FY26) to 30-50 percent (FY28). Hyperscaler revenue growth justifies most of the capex but some 2026-2027 commitments look retrospectively oversized. Stock multiples compress modestly. The capex cycle continues but at deceleration rates that allow the market to adjust without crisis.
Bearish scenario · 20% probability · “The buildout overshot by 25-40 percent.” AI demand grows 15-30 percent annually through 2027. Enterprise deployment falls short of operational expectations. Capacity utilization drops to 65-75 percent through 2027. Impairment cycles in 2027-2028 reach $150-300B aggregate across the Big Four. NVIDIA growth decelerates sharply. Hyperscaler stock multiples compress 30-50 percent. The capex cycle goes through a “pause-and-digest” period analogous to the post-2001 telecom infrastructure pause. AI deployment continues but at materially slower pace through 2028-2030.
The 30/50/20 probability allocation reflects the genuine structural uncertainty. The base scenario is most likely because the demand signals through Q1 2026 are real but the supply signals (capacity coming online) are also real, and the two are unlikely to balance perfectly. The bullish scenario requires demand to outpace capacity meaningfully; the bearish scenario requires capacity to overshoot demand meaningfully. The base scenario assumes mostly-balanced trajectories with some lumpy adjustment.
7. The deeper signal · capital intensity is the new tech baseline
The $725B 2026 capex commitment is the most consequential single number in tech in 2026. The deeper structural signal is what the number says about the new economics of tech-platform leadership.
Signal 1 · Capital intensity has reset upward. Pre-AI hyperscaler capex was 10-15 percent of revenue. Current is 25-30 percent of revenue. Some forecasts project 30-35 percent through 2027. The reset is not transitional — it is the new baseline. Tech-platform leadership now requires capital-deployment scale that fewer companies can execute. The competitive moat is partly capital availability rather than purely product or technology innovation.
Signal 2 · Debt financing has become structural. Hyperscalers are now outspending free cash flow and raising debt to fund the buildout. Microsoft, Amazon, and Alphabet have all materially increased debt issuance. The financial-engineering pattern (covered in the Anthropic-Blackstone JV dispatch) has implications across the AI ecosystem: equity capital alone is insufficient at the scale the buildout requires; debt and structured financing are now necessary. The cost-of-capital impact through 2027-2028 will be material.
Signal 3 · Concentration intensifies. The $725B is concentrated in four companies (or five with Oracle). The compute infrastructure that serves the global AI economy is being built by a tiny number of operators. The structural concentration creates vulnerability (single-point-of-failure for major workloads) and pricing power (the four operators set effective infrastructure pricing for the rest of the economy). Antitrust implications through 2027-2028 are likely.
Signal 4 · The non-AI tech economy is being relatively underfunded. Capital that flows into AI infrastructure is capital that does not flow into other tech investments. The “AI tax” on the rest of the tech economy through 2026-2028 is meaningful. Non-AI tech segments (consumer software, enterprise software outside of AI categories, hardware excluding AI accelerators) face capital scarcity relative to historical norms. The relative underfunding produces lower innovation in non-AI tech segments through the capex cycle.
Signal 5 · The next leg of growth requires new categories. The current buildout is sized for known AI applications (LLM-based agents, image generation, code completion, enterprise copilots). The bullish case requires new application categories that consume the capacity at higher utilization rates. Robotics, autonomous vehicles, scientific computing, multimodal generation at scale, AGI-level systems. Each category has different demand profiles and different timeline assumptions. The success of the capex cycle through 2028-2030 depends on new application categories materializing on schedule.
What to Do This Quarter
1. NVIDIA investors. Reset position sizing based on structural-pricing-power compression rather than absolute dollar growth. The bull case requires NVIDIA to maintain addressable share through the FY27-FY28 cycle; in-house silicon migration argues that share compresses. Position accordingly. Consider AMD, Broadcom, and downstream networking suppliers as partial substitutes that may benefit from the compression.
2. Hyperscaler investors. Treat capex commitment as both tailwind and risk factor. Microsoft is best-positioned through capacity-constrained Azure demand. Alphabet is best-positioned through TPU silicon independence. Amazon is best-positioned through Trainium/Inferentia revenue diversification. Meta is most exposed through internal-product-only revenue offset. Position the four differently rather than treating them as equivalent.
3. Enterprise customers. Use the buildout to negotiate. Capacity is becoming abundant; pricing is coming under structural pressure. 2-3 year contracts with capacity guarantees + price-discount escalators capture the unit-cost reduction as the buildout absorbs. Multi-cloud sourcing becomes more attractive as capacity scarcity ends.
4. AI labs and infrastructure providers. Plan for capacity glut by H2 2027. The capex commitment produces more compute capacity than current demand can absorb at current pricing. Pricing pressure on API services will compound through 2027-2028. The China sphere cost gap (5-30× cheaper) makes this more acute. Margin guidance for the next 18 months should explicitly model capacity-driven price compression.
The Strategic Read
Q1 2026 hyperscaler earnings revealed a $725 billion 2026 AI capex commitment, the largest capital-expenditure cycle in modern tech history. Microsoft $190B, Amazon $200B, Alphabet $185B, Meta $125-145B. The capex cycle represents 25-30 percent of hyperscaler revenue, double the pre-AI baseline. NVIDIA, the obvious beneficiary, fell after the earnings rather than rallying — the market is repricing the structural questions that capex doesn’t answer.
Five structural risks resolve through 2027-2028. Depreciation impairment cycles if utilization drops below 80 percent. Power-grid constraints that delay deployment. In-house silicon migration that compresses NVIDIA’s addressable share. Demand-pull failure if enterprise AI deployment falls short. Geopolitical and regulatory disruption that fragments the buildout assumption. The risks are interdependent; worst-case compounds them through 2028.
Three scenarios are plausible. Bullish (30%): demand grows 60-100% YoY, utilization holds, capex trajectory matches Jensen’s $2.8T-by-2028 projection. Base (50%): demand grows 30-60% YoY, utilization 75-85%, modest impairment in 2028, NVIDIA growth decelerates manageably. Bearish (20%): demand grows 15-30% YoY, utilization drops to 65-75%, $150-300B impairment across the Big Four, multi-year capex pause analogous to post-2001 telecom.
The deeper signal is structural. Capital intensity has reset upward as the new baseline for tech-platform leadership. Debt financing has become structural; equity capital alone cannot fund the buildout. Concentration intensifies in four to five operators. Non-AI tech segments are being relatively underfunded. The next leg of growth requires new application categories (robotics, autonomous, scientific computing) that materialize on schedule.
The honest assessment: the capex commitment is real, the demand signals are real, the supply signals are real, and the balance between them is the structural question that resolves through Q3 2026 to Q4 2027 earnings cycles. Each quarterly print produces incremental data on whether the buildout is right-sized, oversized, or undersized relative to the demand. Q1 2026 was a beat-and-raise across all four hyperscalers; Q2 will reveal whether the pattern holds or moderates.
The connection to prior dispatches runs deep. Compute concentration is the structural fact that the $725B reinforces. Anthropic IPO economics faces both the tailwind (capacity availability) and the risk (capacity-driven price compression). The China Sphere cost gap compounds the price-compression risk. The continual learning timeline is the application-category question that determines whether the next leg of capex demand materializes. The Q3 SaaS pre-brief tracks the demand-pull translation in real time.
The $725B is the number. The questions it doesn’t answer are how the number translates into 2027-2028 returns. Both halves matter.
The $725B 2026 hyperscaler capex is the largest capital-expenditure cycle in modern tech history. The number is real. The structural questions — depreciation, power, in-house silicon, demand-pull, geopolitical — are also real. Resolution runs through 2027-2028.
About the Author
Thorsten Meyer is a Munich-based futurist, post-labor economist, and recipient of OpenAI’s 10 Billion Token Award. He spent two decades managing €1B+ portfolios in enterprise ICT before deciding that writing about the transition was more useful than managing quarterly slides through it. More at ThorstenMeyerAI.com.
Related Dispatches
- The Compute Concentration Audit — AWS / Azure / GCP structural fact
- The Anthropic IPO Disclosure Document — what the S-1 has to say
- The China Sphere Capability Gap Q2 Update — five labs, narrowing frontier
- Q3 2026 SaaS Earnings Pre-Brief — agentic disruption thesis litmus test
- The Continual Learning Research Map — Memento Constraint status
- The 2028 Model Lab Endgame — scenario forecast
Sources
- Microsoft Q3 fiscal 2026 earnings (April 29, 2026) — $30.88B capex, +84% YoY; AI revenue $37B run rate
- Amazon Q1 2026 earnings (April 29, 2026) — $44.2B capex; AWS +28%; chip business $20B run rate
- Alphabet Q1 2026 earnings (April 29, 2026) — $35.67B capex (>2× YoY); Google Cloud backlog $460B+
- Meta Q1 2026 earnings (April 29, 2026) — capex raised to $125-145B; cited component pricing
- NVIDIA Q4 fiscal 2026 earnings (February 2026) — $62.31B data center revenue, +75% YoY
- Yahoo Finance · Magnificent 7 earnings rush reveals AI spending surge, $725B in 2026
- Motley Fool · Major hyperscalers just reported earnings, NVIDIA was the winner
- 24/7 Wall St. · The Big 4 hyperscalers are spending $710B on AI + Hyperscalers hit $700B in 2026 AI spending plans
- BigGo Finance · The brutal truth behind big tech’s AI arms race — Morgan Stanley $740B aggregate
- Sherwood News · NVIDIA tumbles after hyperscaler earnings — GPU constraint shift analysis
- Fortune · Jensen Huang February 2026 commentary · $2.8T projection
- Stanford HAI 2026 AI Index — “year of evaluation” framing
- AInvest · NVIDIA and Hyperscalers Face the AI Evaluation — 56× P/E + 6-year depreciation
- StartupHub.ai · NFJ Investment Group · “Largest Capex Cycle in Modern History” framing