
There’s a failure mode in large automated systems that doesn’t trip any alarms, because every individual decision is correct. The throughput graph looks healthy. No errors fire. And yet the system is quietly strangling itself. You only see it when you stop measuring how much and start measuring where.

Get business pricing on tech for your team
- Business-only prices and quantity discounts
- Tax-exempt purchasing
- Multiple users, one account, clear invoices
That’s exactly what happened across a publishing network I run — 474 WordPress sites fed by two cooperating systems. The numbers said everything was fine. A 28-day audit said otherwise. This is the story of the symptom, the diagnosis that refused the obvious answer, and the three-part fix that touched both systems independently — and why that two-system split is what made the problem solvable at all.
When a content network starts publishing to itself
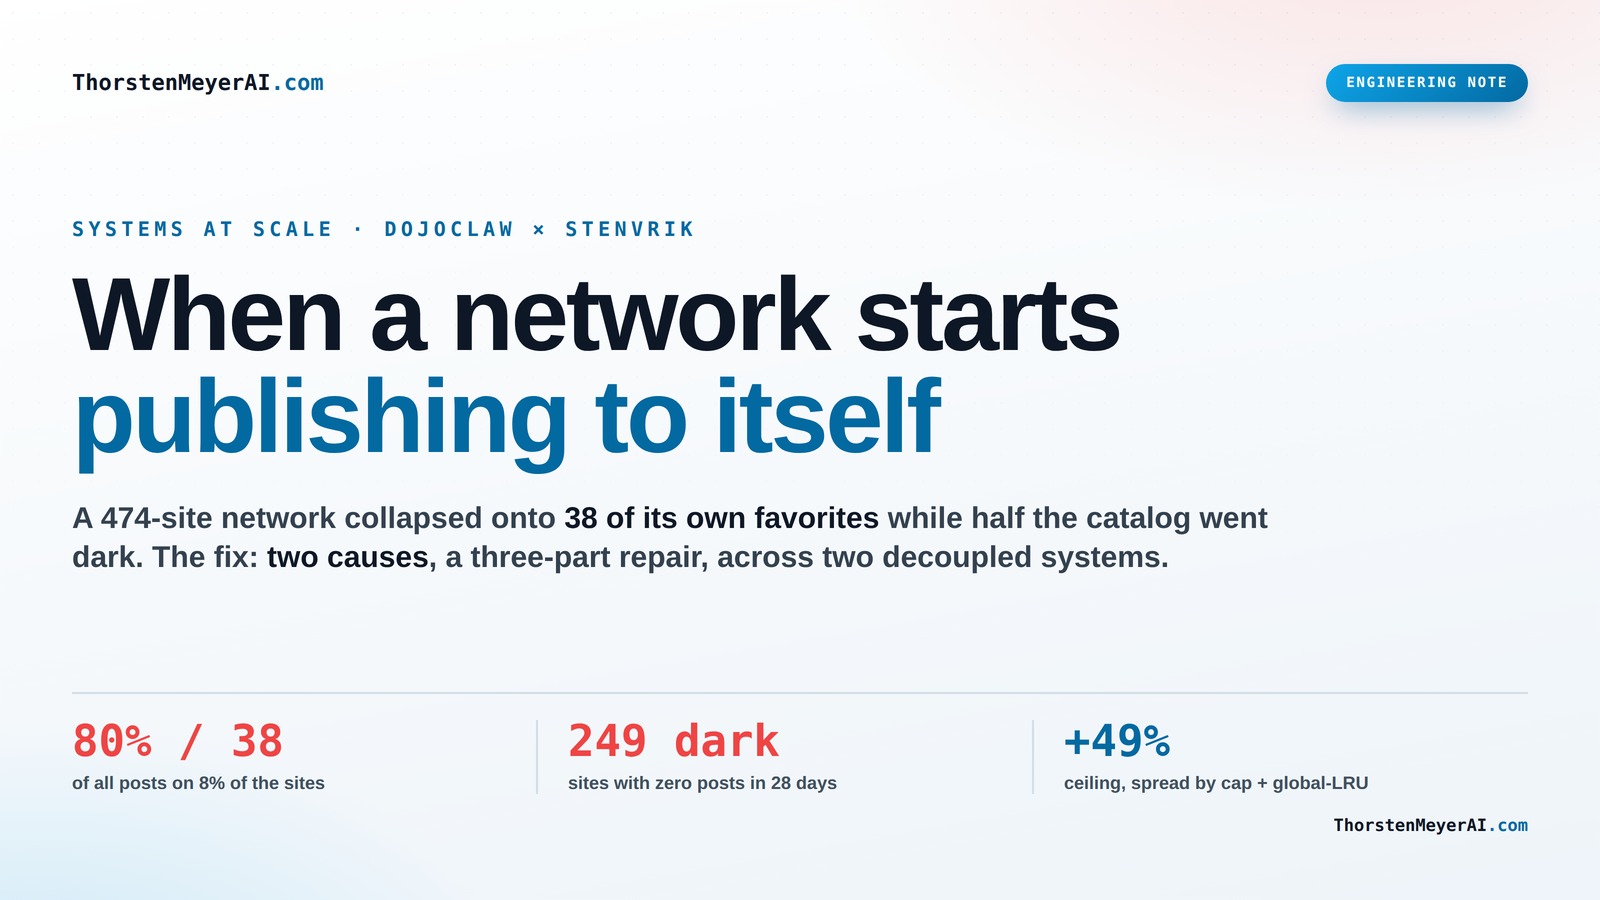
A 474-site network quietly collapsed onto 38 of its own favorites while half the catalog went dark. The throughput graph looked fine. The fix wasn’t one thing — it was two causes and a three-part repair across two decoupled systems.
News-intelligence layer
Ingests hundreds of feeds, scores & geo-tags stories, surfaces what’s trending.
SUPPLY · what’s worth coveringAI content engine
Rewrites a story in each site’s voice and fans it out across the catalog.
PLACEMENT · where it lands & how it reads80% of output on 8% of sites
A 28-day audit, bucketed per site, was lopsided in a way the totals had hidden. Every individual placement was “correct” — the aggregate was a slow-motion failure.
Where 28 days of syndication actually landed
474-site catalog · per-site auditAs an affiliate, we earn on qualifying purchases.
Not one bug — two independent causes
The tempting move is to blame the matcher and move on. The data showed two distinct problems living on two different systems, each needing its own fix.
Within-topic concentration
The matcher kept surfacing the same broad tech sites for every tech story, and rotation only shuffled candidates within the matched pool. A site that never entered the pool could never get a turn — fair only among the already-chosen.
Supply ≠ demand
53% of supplied content was tech/AI — but only ~13% of sites are. The catalog skews the other way, so those sites starved for on-topic material.
content network monitoring software
As an affiliate, we earn on qualifying purchases.
As an affiliate, we earn on qualifying purchases.
Watch the network rebalance
Each square is one of the 474 sites; color is how much it’s publishing. Toggle the selection logic to see placement spread off the red-hot favorites and into the dark long tail.
Placement simulator
Same matcher relevance gate either way — the only change is how candidates are ordered after it.
As an affiliate, we earn on qualifying purchases.
Placement, supply, throughput
Two causes meant the fix had to touch both systems — and only then could the ceiling rise without re-concentrating the load.
Placement levers
DojoClaw- Per-site weekly cap — any site over
25posts/7d drops from the pool, pushing selection into the long tail (relaxes only if it would starve a fan-out). - Global LRU — order by network-wide recency, not just within-topic, so sites idle across the whole network float to the top.
- Starvation floor — guaranteed by construction: the most-idle eligible site is always within the picks.
Supply rebalance
Stenvrik- Audited existing feeds for liveness — removed ones returning HTTP 200 but zero items (broken RSS).
- Added a verified batch across Home, Garden, Health, Food, Fashion, Auto, Science, Pets & more — every feed fetched live first, weighted to the most idle categories.
- Flagged throttled feeds (big publishers exposing only 1–2 items) for replacement rather than burying the risk.
Throughput raise
Scheduler- Fan-out width
maxSites 5 → 7— the extra slots land on fresh sites because the cap is now enforcing. - Quota depth
K 2 → 3— every category’s daily cap scaled ×1.5. - Honest note: a documented
~950/dayintent the code never delivered (units quirk) stays gated behind a sign-off.
content publishing automation tools
As an affiliate, we earn on qualifying purchases.
As an affiliate, we earn on qualifying purchases.
The scoreboard — with an honest asterisk
The change is behavioral: it shapes future placement, it doesn’t retroactively rescue the month sites sat dark. The proof is in the next weeks of data — which is why the instrumentation is the real deliverable.
Supply and placement are genuinely separate concerns. Diagnosing the imbalance meant looking at both sides and seeing they disagreed. A clean boundary made a failure that spanned both legible — good system boundaries organize thought, not just code.
Ordering by load & idleness sacrifices a little topical ranking for dramatically better coverage. All candidates already cleared the relevance gate — so it’s a deliberate trade, not a regression.
Two systems, one pipeline
Before the problem, the cast. The operation runs on a deliberate division of labor.
Stenvrik is the news-intelligence layer — a live "news globe" that ingests hundreds of RSS and Atom feeds across two dozen topics, scores and geo-tags stories, and surfaces what's trending by drawing real-time signal from sources like Hacker News, Google Trends, and X. It is the supply of raw editorial signal: it decides what's worth covering.
DojoClaw is the AI content engine — it takes a story, rewrites it in each destination site's voice, and fans it out across the catalog of WordPress magazines. It is the production and distribution layer: it decides where a story lands and how it reads.
The two talk over a small local HTTP contract: one story flows in, up to N site-specific articles flow out. Critically, they're decoupled. Stenvrik judges editorial worth over a firehose of feeds; DojoClaw judges placement across a large network. Hold that separation in mind — it becomes the punchline.
The symptom: 80% of output on 8% of sites
Charts have a way of making invisible problems impossible to unsee. A 28-day audit of syndication output, bucketed per site, was lopsided in a way the totals had completely hidden.
Eighty percent of all posts landed on just 38 sites. The top four — all technology titles — were each absorbing more than 200 articles a week, roughly thirty a day. Meanwhile, 249 of the 474 sites, fifty-three percent of the entire catalog, received zero posts in the whole window. Half the network was dark.
For a content network, this is the worst of both worlds at once. The busy sites are at real risk of looking spammy to search engines — thirty near-simultaneous articles a day is not the publishing rhythm of a healthy independent magazine. And the idle sites accrue nothing: no fresh content, no crawl interest, no value whatsoever. The network had, without anyone instructing it to, decided to publish to a handful of its own favorites and let the rest atrophy. Every individual placement decision had been "correct" — and the aggregate was a slow-motion failure.
The diagnosis: refusing the obvious answer
The tempting move here is to blame the site-matcher, tweak its rotation, and declare victory. I've learned to distrust that reflex. When a system misbehaves at scale, the first plausible cause is rarely the whole cause. So before touching anything, I charted the data from both sides of the pipeline — and it showed two genuinely distinct problems that needed two different fixes.
Cause one: within-topic concentration. The four runaway sites were all in the Technology or AI & Machine Learning categories. The LLM matcher kept surfacing the same broad, category-fit sites for every tech story, and the rotation logic only shuffled candidates within the matched topic pool. That's the trap: a site that never entered the pool in the first place could never get a turn, no matter how idle it was. The rotation was fair only among the already-chosen — which is to say, not fair at all.
Cause two: supply didn't match demand. This was the deeper one, and it lived on the other system entirely. Fifty-three percent of the content Stenvrik was supplying was tech or AI — but only about thirteen percent of the 474 sites are tech or AI. The catalog actually skews heavily the other way: 103 Home sites, 68 Health, 37 Food, 28 Fashion. Those categories were barely receiving anything, not because placement was broken for them, but because there was almost nothing on-topic flowing in to place. Tech content piled onto a few tech sites while Home, Health, and Food sites starved for lack of material.
This is the part that matters for anyone running a similar system: the imbalance was not a single bug. It was a placement problem and a supply problem wearing the same symptom. Fix only one and the other keeps the network lopsided. You cannot spread content that doesn't exist, and you cannot fix a supply mismatch with smarter routing.
The fix, part one — placement (DojoClaw)
The first repair went into DojoClaw's selection path, with three levers designed to push the fan-out off the matcher's favorites and into the long tail.
A per-site weekly cap came first. Any site that has already published its cap in the trailing seven days — twenty-five by default — drops out of the candidate pool, forcing selection deeper into the network. The cap is not rigid: it relaxes only if enforcing it would starve a story's fan-out below its target width, so the network never blocks itself.
Then a global least-recently-used ordering. This is the subtle, important one. Selection now orders candidates by network-wide recency — the last time a site published anything at all, not just something in the current topic. Sites that have been idle across the entire network float to the top of the queue. That single reframing is what lets a dormant Home site finally surface for a story it can carry, instead of being invisible because it never ranked in a tech pool.
The third lever, a starvation floor, falls out almost for free. Because the ordering already front-loads the least-loaded, most-idle eligible sites, the most-starved site is guaranteed to be within the picks by construction — the floor doesn't need separate enforcement.
All of these operate after the matcher's relevance gate. Every candidate has already cleared the bar for being a reasonable home for the story; ordering by load and idleness simply trades a little topical ranking for dramatically better coverage. That tradeoff is the entire intent, not a side effect.
The fix, part two — supply (Stenvrik)
Placement levers can only redistribute the content that exists, so the second repair went to Stenvrik's feed registry to actually generate inflow for the starved categories.
The existing feeds in the under-served topics were audited for liveness first. Several were returning HTTP 200 while delivering zero items — broken RSS that looked alive but supplied nothing — and were removed. Then a verified batch was added across several rounds, every feed fetched live and confirmed to return real items before being accepted. Home, Garden, Health, Food, Fashion, Auto, Science, Pets, Sports, Travel, Parenting, and Arts all gained high-volume sources, weighted deliberately toward the categories with the most idle sites. The registry grew meaningfully, tilted to correct the supply mix rather than just to be bigger.
One honest caveat got documented rather than buried: several large-publisher feeds now expose only one or two items through a throttled RSS. They were left in but flagged for replacement, because a feed that technically works but barely supplies is a future starvation risk hiding in plain sight.
The fix, part three — throughput
With placement spreading and supply flowing, the daily ceiling could finally be raised without simply re-concentrating the load. Two dials moved. Fan-out width went from five sites per story to seven — and because the per-site cap is now enforcing, those two extra slots land on fresh sites rather than reinforcing the favorites. Quota depth scaled up by half, lifting every category's daily article cap. Net effect: the scheduler's ceiling rose from roughly 188 to about 280 articles a day, a 49% increase, on top of the quota-exempt flagship lane.
And here, too, an honest note made it into the documentation. The registry once described a roughly 950-a-day intent that the code never actually delivered, owing to a units quirk. Reaching that figure would require either an aggressive tier or a deliberate correction to the quota table — both deliberately gated behind a sign-off. Writing that down matters: an aspirational number that the system never hit is exactly the kind of folklore that misleads you a year later. Better to record what the code does than what a comment once hoped.
What it adds up to — and the honest asterisk
On paper the scoreboard is clean: concentration now shaped by cap, global-LRU, and floor instead of running wild; the dormant tail shrinking as supply fills it; a larger verified feed registry; a 49% higher ceiling; fan-out widened from five to seven.
But the genuinely honest framing is that this change is behavioral. It shapes how future placement unfolds; it doesn't retroactively rescue the sites that sat dark for a month. The proof is in the next couple of weeks of data, not in the diff. That's why the most valuable artifact of the whole exercise might be the instrumentation — a per-site weekly-bucket query, documented and repeatable, so the dormant tail can actually be watched as it fills instead of being assumed fixed. A fix you can't measure is a hope.
Why two systems, not one
Here's the punchline I promised. This whole episode is the strongest argument I have for keeping Stenvrik and DojoClaw as separate systems rather than fusing them into one tidy monolith.
Supply and placement turned out to be genuinely separate concerns. One is about editorial judgment over a firehose of feeds; the other about fair, organic distribution across a large site network. Diagnosing the imbalance required looking at both sides independently — the content mix coming out of Stenvrik and the site-category demand inside DojoClaw — and seeing that they disagreed. The fix then touched each side on its own terms: registry work on one, selection logic on the other.
A monolith would have blurred exactly where the problem lived. The symptom — concentration — appeared in the distribution layer, but half its cause was upstream in supply. When your architecture draws a clean line between two concerns, a failure that spans both is legible: you can stand on one side, look across, and see that the two halves don't match. Collapse that line and the same failure becomes a single tangled mess with no obvious seam to reason about.
Good system boundaries don't just organize code. They organize thought. That's the real lesson here — and the reason the next imbalance, whatever it is, will be easier to find.
Stenvrik (https://stenvrik.com/) is the news-intelligence layer; DojoClaw (https://dojoclaw.com/) is the AI content engine. Figures reflect the May 2026 engineering audit and the behavioral changes made in response; the network's response is being tracked.
Halloween Picks
halloween
As an affiliate, we earn on qualifying purchases.