By Thorsten Meyer — May 2026
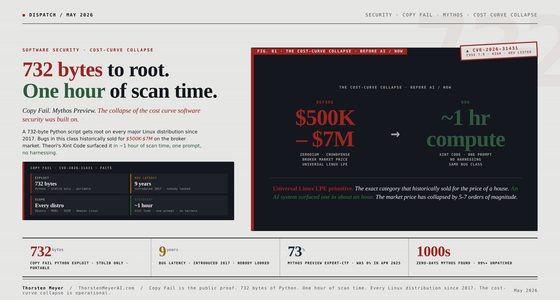
The April-May 2026 SaaS earnings cycle delivered a structurally important data point. ServiceNow beat consensus across every top-line and profitability metric, raised full-year subscription guidance, raised AI ACV guidance from $1 billion to $1.5 billion (a 50 percent increase), and the stock opened down 18 percent the next morning. By close, NOW had its worst day on record. Salesforce, in parallel, restated its fiscal 2026 segments to separate Agentforce Apps ($26.7B subscription) from Data 360, Platform & Other ($12.7B) — implicit acknowledgment that the old per-seat narrative no longer captures what’s happening to SaaS revenue. Both moves point in the same direction. Investors are repricing SaaS to absorb the consumption-pricing transition. The repricing is happening regardless of whether individual companies beat earnings.
Q3 2026 earnings (July-August reports for calendar Q2) is the next litmus test. The companies reporting will provide the data that either confirms or refutes the agentic-disruption thesis at scale. This dispatch is the pre-brief. What the market is watching, what each company needs to prove, what scenarios are on the table, and what the strategic implications are for SaaS investors, founders building agentic competitors, and the enterprise customers caught in the middle of the transition.
The dispatch on the Anthropic-Blackstone-Goldman JV covered the structural play that frontier labs are making to absorb mid-market AI deployment. The dispatch on the China Sphere capability gap covered the cost dynamics that compress production-tier pricing. Both directly affect SaaS economics: agentic deployment is increasingly served by frontier-lab vehicles plus Chinese low-cost APIs rather than by traditional SaaS licensing. Q3 earnings is where this shows up in the public companies’ reported numbers.
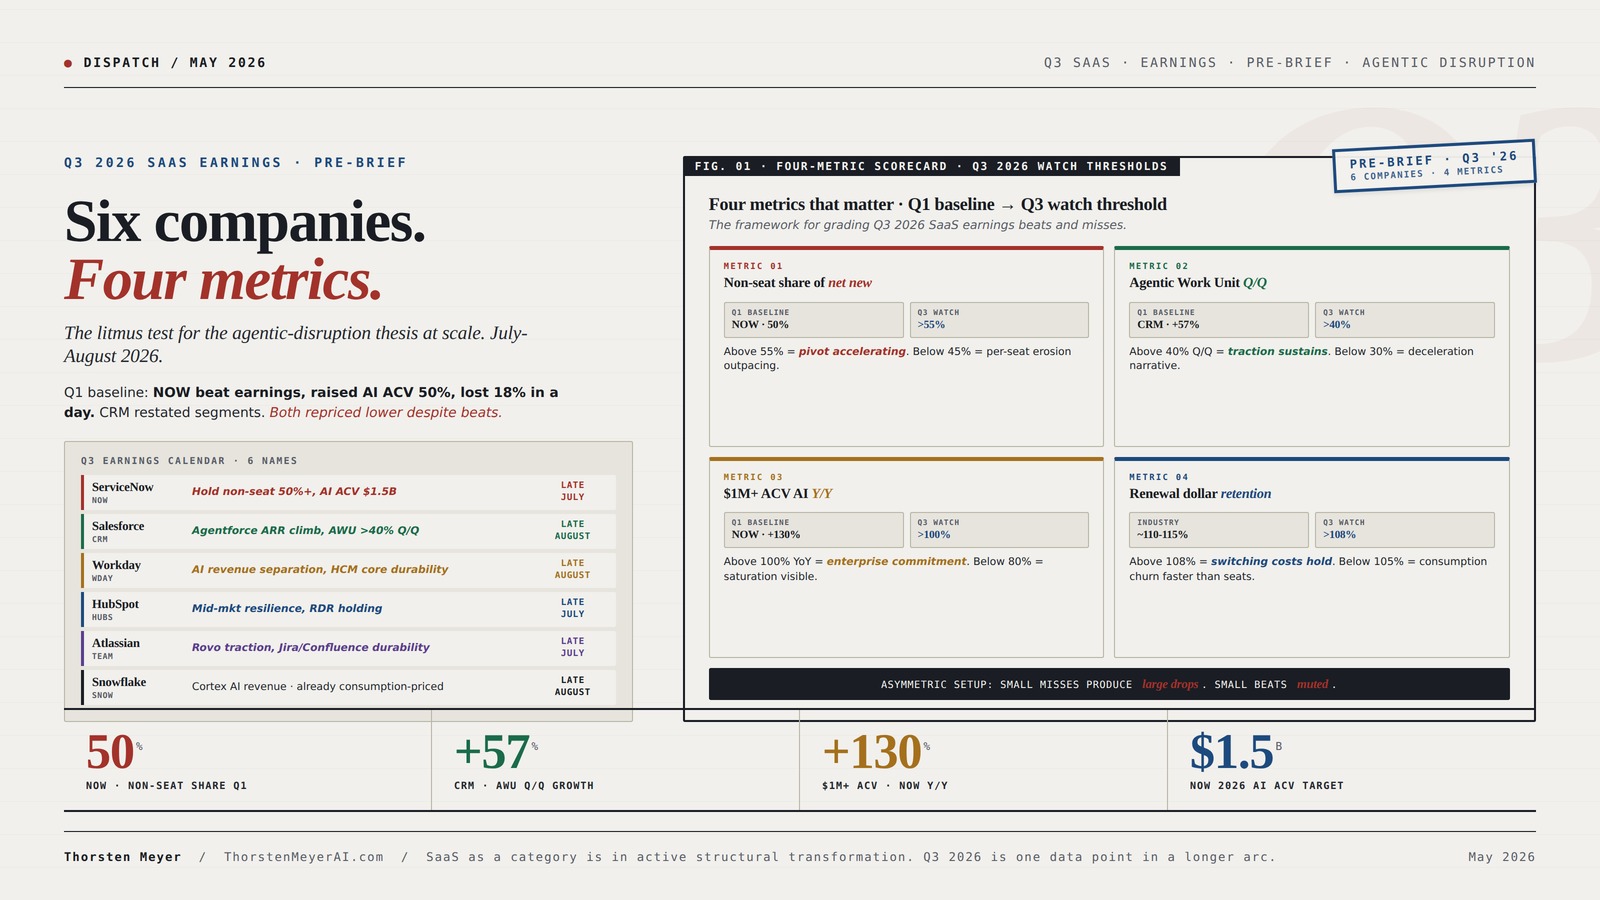
Six companies. Four metrics.
The litmus test for the agentic-disruption thesis at scale. July-August 2026.
Q1 baseline: ServiceNow beat earnings, raised AI ACV 50%, lost 18% in a day. Salesforce restated segments to separate Agentforce Apps from Data 360. Both stocks repriced lower despite beats. The Q3 cycle either confirms the consumption pivot is durable or accelerates the cohort selloff.
Four metrics. Four watch thresholds.
Investor focus has consolidated around four metrics that determine Q3 reactions. Each beats or misses produces asymmetric stock reactions: small misses produce large drops, small beats produce muted reactions.

Google Antigravity Data Analytics for Non-Coders: A Step-by-Step Guide to Automating Dashboards and Replacing Excel Without Python (Google Antigravity Mastery Series Book 4)
As an affiliate, we earn on qualifying purchases.
As an affiliate, we earn on qualifying purchases.
Six companies. July-August 2026.
Six major SaaS companies report Q3 2026 calendar reports across July-August 2026. Each needs to prove specific elements of the four-metric scorecard.
July
name
August
name
August
exposed
July
exposed
July
exposure
August
exposure
![DeskFX Free Audio Effects & Audio Enhancer Software [PC Download]](https://m.media-amazon.com/images/I/41fXbDohyuS._SL500_.jpg)
DeskFX Free Audio Effects & Audio Enhancer Software [PC Download]
- Audio Transformation: Enhance sound from speakers and headphones
- Sound Quality Improvement: Adjust audio with various effects
- Audio Control: Manage sound through hardware settings
As an affiliate, we earn on qualifying purchases.
As an affiliate, we earn on qualifying purchases.
Three outcomes. One cohort.
25/50/25 probability allocation reflects genuine uncertainty in the data. Q1 was already mixed (beats produced selloffs); Q3 follows the same pattern unless metrics move decisively.
- Non-seat 50%+ sustainsNOW pivot durable.
- AWU >50% Q/QCRM Agentforce traction holds.
- $1M+ ACV >120% Y/YEnterprise concentration accretive.
- RDR >108%Switching costs real.
- Outcome: NOW recovers 18% drop. Multiple expands.
- Non-seat 50%NOW pivot equilibrium.
- AWU 35-45% Q/QCRM deceleration visible.
- $1M+ ACV 80-100%Saturation early signals.
- RDR 105-110%Durability uncertain.
- Outcome: Multiples compressed through Q4 next litmus test.
- Non-seat <45%NOW pivot stalled.
- AWU <30% Q/QCRM Agentforce deceleration confirmed.
- $1M+ ACV <80%Enterprise saturation visible.
- RDR <105%Consumption customers churning faster than seats.
- Outcome: 10-20% cohort compression. Recovery extends mid-2027.
SaaS as a category is in active structural transformation. Each quarterly cycle through 2026-2027 produces incremental data on whether the per-seat-to-consumption transition is durable or destructive. Q3 2026 is one data point in a longer arc.

The Art of Azure Fundamentals: Effectively Explain Microsoft Azure Fundamentals to Others and Become the Most Valuable Professional on the Team (Business Strategy Tools)
As an affiliate, we earn on qualifying purchases.
As an affiliate, we earn on qualifying purchases.
Four assignments. By role.
Update positioning ahead of Q3.
Long ServiceNow / Salesforce on non-seat-share + AWU-growth thesis if you believe consumption pivot is durable. Underweight if structurally worse than per-seat. Use four-metric scorecard to update each quarterly cycle through 2027. Asymmetric setup means small misses produce large reactions.
Time the Q3 cycle precisely.
If incumbents miss → accelerate customer-acquisition + fundraising. If incumbents beat → prioritize retention + unit economics over top-line. 25/50/25 probability suggests cautious-optimistic positioning is default. The customer-acquisition window opens or closes based on Q3 prints.
Negotiate multi-year protections.
AWU rate caps, renewal-term commitments, exit provisions. Incumbents that commit are pricing for durable equilibrium; incumbents that resist are extracting transitional premium. Q3 reveals which is which. Time multi-year commitments to incumbent transparency on consumption pricing.
Engage on structured-financing.
Anthropic-Blackstone JV template applies to SaaS facing same scaling challenge. Engagements through July-September; SaaS companies missing on four metrics become more receptive. Window for advantaged structuring is open through Q4 2026; thereafter pricing advantage compresses as template replicates.

475 Tax Deductions for Businesses and Self-Employed Individuals: An A-to-Z Guide to Hundreds of Tax Write-Offs
As an affiliate, we earn on qualifying purchases.
As an affiliate, we earn on qualifying purchases.
Executive Summary · The Four-Metric Scorecard
| Metric | Q1 2026 baseline | Q3 2026 watch threshold | Implication if beats | Implication if misses |
|---|---|---|---|---|
| Non-seat share of net new business | ServiceNow 50% | >55% sustains pivot | Consumption transition accelerating; durability question intensifies | Pivot stalled; per-seat erosion may exceed consumption growth |
| Agentic Work Unit growth (Q/Q) | Salesforce +57% Q/Q to 2.4B AWUs | >40% Q/Q | Agentforce traction sustains; multiple of compute-ARR durable | Deceleration; Agentforce hype outpacing economics |
| $1M+ ACV AI customers (Y/Y) | ServiceNow +130% Y/Y | >100% Y/Y | Concentration of high-ACV signals durable enterprise commitment | Mid-market AI spend front-loaded, decelerating |
| Renewal dollar retention | Industry baseline ~110-115% | >108% | Consumption customers expanding; switching costs holding | Below 105% suggests consumption customers churning faster than seat customers ever did |
Plus three structural questions that will get answered:
- Will Salesforce’s restated-segments approach become industry standard? — If three or more major SaaS names follow with similar Agentic vs. Traditional segmentation by year-end, transparency-benchmark shifts permanently
- Will the consumption-pricing margin compression show up in guidance? — Operating margin guidance from each name signals whether they think the consumption mix is durable or transitional
- Will any major SaaS name announce a JV-style structural response? — Following the Anthropic-Blackstone or OpenAI-TPG template — meaning a SaaS company partners with PE consortium to fund the AI engineering pool
The April-May earnings cycle showed ServiceNow already at 50 percent non-seat. Each subsequent earnings cycle either accelerates this transition or stalls it. The market has repriced ServiceNow and Salesforce to anticipate continued migration; if migration stalls, those names re-rate higher. If migration accelerates, the entire SaaS cohort gets repriced lower as the per-seat license economic model becomes structurally suspect across the category.
1. The Q1 2026 baseline · what just happened
Three earnings releases in April and early May established the Q3 watch baseline.
ServiceNow Q1 2026 (reported April 22). Subscription revenue $3.67B, +22% YoY. Beat consensus across every line. AI ACV guidance for 2026 raised from $1B to $1.5B (+50%). Now Assist customers spending over $1M ACV grew over 130% YoY. Bill McDermott disclosed in the call that 50 percent of net new business comes from non-seat models — tokens, infrastructure consumption, connector usage — and that half of total revenue is consumption-based. Stock dropped 18 percent the next morning despite the beat. Worst day on record for NOW.
Salesforce Q4 FY26 (reported late February for fiscal year ending Jan 2026). Total revenue $41.5B, +10% YoY. Agentforce ARR reached $800M, up 169% YoY. Closed 29,000 Agentforce deals, +50% Q/Q. Total Agentforce + Data 360 ARR exceeds $2.9B, +200% YoY (including $1.1B Informatica Cloud ARR). Salesforce introduced Agentic Work Units (AWUs) — a metric that measures tasks accomplished by AI agents. 2.4 billion AWUs delivered to date, growing 57 percent Q/Q. The introduction of AWUs is itself the structural signal — Salesforce is explicitly competing on consumption-tier metrics rather than per-seat metrics, and asking investors to track AWU growth as a primary durability indicator.
Salesforce restated-segments announcement (May 2026). Salesforce announced plans to break out fiscal 2026 numbers into “Agentforce Apps” and “Data 360, Platform & Other,” with restated FY25 and FY26 numbers. Agentforce Apps: $26.7B subscription, +7% growth (cc). Data 360, Platform & Other: $12.7B, +15% growth (cc). The restated segments make explicit what the AWU metric only suggested — Salesforce thinks of itself as having two distinct businesses now, with the agentic side growing slower in dollar terms but representing the strategic future.
Both companies’ stock action through April-May reflects the market’s repricing logic: the agentic-AI-driven business is the strategic future but the per-seat-license business is the dollar-revenue present, and the transition between them produces revenue-durability uncertainty. Until the consumption-tier customers prove they renew at per-seat rates, the market discounts SaaS multiples. The repricing happens regardless of beats.
2. The four metrics that matter
Investor focus has consolidated around four metrics that will determine Q3 reactions.
Metric 1 · Non-seat share of net new business. ServiceNow set the benchmark at 50 percent. The number captures how much of the new revenue is consumption-priced versus seat-priced. Above 55 percent in Q3 confirms the pivot accelerating; below 45 percent suggests stall. The mechanism: if per-seat erosion (driven by AI making fewer seats necessary) outpaces consumption growth (driven by new AWU/token customers), the company gets squeezed. If consumption growth outpaces seat erosion, the math works. ServiceNow’s 50 percent puts it in equilibrium; Q3 reveals which direction it tilts.
Metric 2 · Agentic Work Unit (or equivalent) Q/Q growth. Salesforce set the benchmark at +57% Q/Q on AWUs. ServiceNow’s Now Assist comparable would be agentic-task-completion counts; Workday’s would be similar. The metric captures whether agentic deployment is actually scaling with customer adoption or whether the early-customer cohort has front-loaded the growth. Above 40 percent Q/Q sustains the durable-multiple-on-compute-ARR thesis; below 30 percent triggers the deceleration narrative.
Metric 3 · $1M+ ACV AI customer count Y/Y growth. ServiceNow set the benchmark at +130% YoY. The metric captures concentration of high-ACV enterprise commitments — these customers do not move easily and represent durable revenue. Above 100% YoY signals continued enterprise commitment to agentic deployment; below 80% suggests the easy-win enterprise customers are saturated and growth has to come from harder-to-close mid-market accounts.
Metric 4 · Renewal dollar retention (RDR). Industry baseline through 2025 was 110-115 percent across major SaaS names. The metric captures whether consumption-pricing customers expand or churn at higher rates than per-seat customers historically did. Above 108 percent suggests consumption customers are sticky — the agentic-deployment switching costs are real. Below 105 percent suggests consumption-pricing customers churn faster than seats ever did, which would be the structural signal that consumption-pricing economics are materially worse than the seat-license economics they’re replacing.
The four metrics interact. A company can beat on AWU growth (M2) and still miss on RDR (M4), which would suggest the new agentic customers churn faster than they’re acquired — explosive growth without durability. A company can hold on RDR (M4) but miss on non-seat share (M1), which would suggest the existing customers are loyal but the consumption pivot isn’t actually happening. The full picture requires watching all four together.
3. The Q3 2026 calendar · who reports and what they need to prove
Six major SaaS companies will deliver Q3 reports in July-August 2026 that bear directly on the agentic-disruption thesis.
ServiceNow (NOW) · late July 2026 · Q2 calendar 2026 report. Needs to prove: non-seat share holds at or above 50%, AI ACV remains on track for $1.5B, $1M+ ACV customer growth sustains 100%+ YoY. McDermott’s “stake in the ground at 50 percent net new from non-seat” is the explicit benchmark. The Q1 18-percent stock drop creates an asymmetric setup: a Q3 beat at the same 50% level may not move the stock; a miss to 40-45% likely produces another double-digit drop.
Salesforce (CRM) · late August 2026 · Q2 FY27 report. Needs to prove: Agentforce ARR continues climbing toward $1.5B+ run-rate, AWU Q/Q growth holds above 40 percent, restated-segments transparency continues. FY27 guidance was initiated at $45.8-46.2B (10-11% growth including ~3pts Informatica). The Q2 print needs to show the second-half re-acceleration that management promised. Watch for whether restated segments produce surprise on the Agentforce Apps growth specifically.
Workday (WDAY) · late August 2026 · Q1 FY27 report. Needs to prove: AI-related revenue accelerating, Workday Illuminate or equivalent AI product traction, durability of HCM core. Workday faces the mid-market disruption pressure most acutely because the Anthropic-Blackstone-Goldman JV and OpenAI-TPG-Bain parallel both target mid-market HR and finance workflows that are Workday’s core customer base. Watch for guidance on AI products separately from core HCM.
HubSpot (HUBS) · late July / early August 2026 · Q2 2026 report. Needs to prove: Mid-market resilience against AI-native CRM alternatives, AI assistant adoption metrics, RDR holding. HubSpot’s mid-market customer base is the most exposed to Salesforce-Agentforce competition plus AI-native CRM startups (Attio, Pipedrive AI features, Folk). Watch for SMB churn signals and ACV-per-customer trends.
Atlassian (TEAM) · late July 2026 · Q1 FY27 report. Needs to prove: Atlassian Intelligence (Rovo) traction, durability of Jira/Confluence in agentic-coding world. Atlassian sits at the intersection of project management software (which agents can coordinate) and developer tooling (which Claude Code, Cursor, and similar are disrupting). Watch for declining seat counts on developer-focused products specifically.
Snowflake (SNOW) · late August 2026 · Q2 FY27 report. Needs to prove: Cortex AI revenue, customer expansion in AI workloads, durability of warehouse pricing. Snowflake is consumption-priced from origination, so the per-seat-to-consumption transition is not its story. Snowflake’s story is whether AI workloads expand its consumption base meaningfully or whether AI workloads shift to specialized infrastructure (NVIDIA NIM, Anyscale, vector DBs).
The six companies span the disruption spectrum. ServiceNow and Salesforce are the canonical names for the per-seat-to-consumption transition; their Q3 prints set the narrative. Workday and HubSpot are the mid-market names exposed to JV-structured deployment competition. Atlassian and Snowflake represent specialized exposure (developer tooling, data infrastructure). The cumulative picture across all six tells the SaaS agentic-disruption story for Q2 calendar 2026.
4. Three scenarios for Q3
The earnings cycle through July-August can produce one of three outcomes for the SaaS cohort.
Bullish scenario · 25% probability. Multiple companies beat across all four metrics. ServiceNow holds non-seat share at 50%+ with sustained AI ACV growth. Salesforce AWU growth above 50% Q/Q. $1M+ ACV customer growth above 120% YoY. RDR above 108%. The narrative shifts to: “the consumption pivot is durable, switching costs are real, agentic deployment is structurally accretive to SaaS revenue.” Stocks re-rate higher: ServiceNow recovers the 18% drop, Salesforce’s restated Agentforce Apps segment becomes the story-driver. The cohort multiple expands.
Base scenario · 50% probability. Mixed results across companies and metrics. ServiceNow holds at 50% non-seat. Salesforce AWU growth decelerates to 35-45% Q/Q. $1M+ ACV growth below 100% YoY but above 80%. RDR holds 105-110%. The narrative remains uncertain: “the consumption pivot is real but deceleration signals are visible; durability question unresolved.” Stocks tread water: no significant re-rating either direction. The cohort multiple stays compressed at current levels through Q4 2026 reporting (next litmus test in late October-November).
Bearish scenario · 25% probability. Multiple companies miss. ServiceNow drops below 45% non-seat (pivot stalled). Salesforce AWU growth below 30% Q/Q (deceleration confirmed). $1M+ ACV growth below 80% YoY (saturation visible). RDR below 105% (consumption churn). The narrative collapses to: “consumption pricing is structurally less durable than per-seat licenses; SaaS multiples are still too high; another leg down on the cohort.” Stocks compress 10-20% more across the cohort. Recovery extends to mid-2027.
The 25/50/25 probability allocation reflects the genuine uncertainty in the data. Q1 2026 was already mixed (beats produced selloffs); Q3 will follow the same pattern unless the four metrics move decisively in one direction. The asymmetric setup means small misses produce large stock reactions and small beats produce muted reactions.
5. The structural questions that will get answered
Beyond the headline metrics, three structural questions will resolve over the Q3 cycle.
Question 1 · Does Salesforce’s restated-segments approach become industry standard? Salesforce’s separation of Agentforce Apps from Data 360/Platform/Other is meaningful transparency. If ServiceNow, Workday, HubSpot, and Atlassian follow with similar restated-segments approaches by Q4 2026 reporting, it becomes the de facto standard for SaaS earnings disclosure and investors get the granularity they need to price agentic-AI growth specifically. If only one or two follow, transparency remains uneven and pricing remains based on opaque aggregate metrics. The signal: each company that does NOT restate is implicitly admitting the agentic-AI growth doesn’t justify the segmentation.
Question 2 · Does consumption-pricing margin compression show up in guidance? Per-seat licenses carry 80%+ gross margin. Consumption pricing carries 60-70% gross margin (more compute-cost share goes to the customer). If the Q3 guidance from major SaaS names shows operating-margin compression of 100-200 basis points YoY, the consumption-pricing economics are visibly worse than the seat-license economics they’re replacing. If guidance holds or improves, the consumption mix is being managed — through higher pricing, lower-cost compute, or both. ServiceNow’s commentary on operating margin will be the most-watched single data point.
Question 3 · Does any major SaaS name announce a JV-style structural response? Anthropic-Blackstone-Goldman and OpenAI-TPG-Bain established a corporate template: PE consortium funds the engineering pool that customer-services demand requires. A SaaS company facing the same scaling challenge — too many enterprise customers wanting agentic deployment, not enough engineers to deliver it — could announce a similar JV structure. The natural candidates: Salesforce + KKR/Apollo, ServiceNow + Vista, Workday + Bain. If any of the six Q3-reporting companies announces such a structure, it confirms the JV approach as a category-wide play and accelerates the structural transformation of SaaS economics.
The questions will likely resolve through 2026-2027 rather than in any single quarter. The Q3 cycle is the next data point, not the resolution.
6. The strategic implications by stakeholder
The Q3 cycle has direct consequences for four distinct stakeholder groups.
For SaaS public-company investors. The asymmetric setup creates clear positioning. Long the names that hold or beat the four metrics; short or underweight the names that miss. Specifically: ServiceNow is binary on non-seat share — stays at 50%+ and the stock works; misses to 40s and another double-digit drop. Salesforce is binary on AWU growth — sustains above 40% Q/Q and the restated segments justify higher multiple; deceleration below 30% and the Agentforce hype loses credibility. Workday is binary on AI revenue separation — provides the disclosure and gets credit for transparency; doesn’t and gets discounted as opaque mid-market name vulnerable to JV-structured competition.
For SaaS founders building agentic competitors. The Q3 cycle either confirms or refutes the disruption thesis. If incumbent SaaS misses on the four metrics, the customer-acquisition window opens wider — incumbent retention concerns push customers to evaluate alternatives. If incumbents beat, the window closes — switching costs prove durable and the disruption thesis weakens. Time fundraising and growth-investment decisions to the Q3 print: aggressive expansion if incumbents miss, cautious positioning if they beat.
For enterprise customers in active transitions. The Q3 cycle reveals which incumbents are committed to durable pricing and which are extracting near-term consumption-pricing premiums while the discount-pricing-vs-disruption window is open. Customers signing multi-year deals in Q3-Q4 should require contractual commitments on AWU/consumption rate caps, renewal terms, and exit provisions — incumbents that are willing to commit are positioning for the long-term consumption-pricing equilibrium; incumbents that resist are extracting near-term margin while they can.
For PE firms and structured-financing players. The Q3 cycle either creates or forecloses opportunities for JV-structure transactions with SaaS incumbents. SaaS companies that miss on the four metrics become more receptive to consortium-funded transformation vehicles (the Anthropic-Blackstone template applied to SaaS). Companies that beat consolidate independent positioning. Watch for industry chatter through July-September on SaaS-PE conversations; the JV announcements typically precede earnings rather than follow them.
What to Do This Quarter
1. SaaS investors. Update positioning ahead of Q3. Position long ServiceNow / Salesforce on the non-seat-share and AWU-growth thesis if you believe the consumption pivot is durable. Position underweight if you believe the consumption-pricing economics are structurally worse than per-seat. Use the four-metric scorecard to update positioning each quarterly cycle through 2027.
2. SaaS founders building agentic competitors. Time the Q3 cycle precisely. If incumbents miss, accelerate customer-acquisition spend and fundraising. If incumbents beat, prioritize customer retention and unit-economics improvement over top-line growth. The 25/50/25 probability allocation suggests cautious-optimistic positioning is the default.
3. Enterprise customers. Negotiate multi-year deals with explicit consumption-pricing protections. AWU rate caps, renewal-term commitments, exit provisions. Incumbents that commit are pricing for durable equilibrium; incumbents that resist are extracting transitional premium. The Q3 cycle reveals which is which.
4. PE firms. Engage in structured-financing conversations with SaaS incumbents through July-September. The Anthropic-Blackstone JV template applies; SaaS companies facing the same scaling challenge are receptive. The window for advantaged structuring is open through Q4 2026; thereafter, the structural template may be replicated and pricing advantage compresses.
The Strategic Read
Q3 2026 SaaS earnings (July-August reports for calendar Q2) is the next litmus test for the agentic-disruption thesis at scale. The Q1 2026 cycle established the baseline: ServiceNow at 50 percent non-seat share, Salesforce at $800M Agentforce ARR with 169% YoY growth, both stocks repriced lower despite beats. The four-metric scorecard — non-seat share, AWU growth, $1M+ ACV count, RDR — will determine Q3 reactions across the cohort.
Three scenarios are plausible. Bullish (25%): multiple beats produce cohort re-rating higher. Base (50%): mixed results sustain compressed multiples. Bearish (25%): multiple misses produce another 10-20% leg down. The asymmetric setup means small misses produce large reactions and small beats produce muted reactions. The genuine uncertainty in the data is structural rather than incidental.
Three structural questions resolve through Q3-Q4: whether Salesforce’s restated-segments approach becomes industry standard, whether consumption-pricing margin compression shows up in guidance, whether any major SaaS name announces a JV-structured response following the Anthropic-Blackstone template.
The strategic implications run by stakeholder. Investors get clear positioning logic on the four metrics. Founders building agentic competitors time their fundraising and customer-acquisition decisions to the Q3 print. Enterprise customers negotiate multi-year deals with explicit consumption-pricing protections. PE firms engage SaaS incumbents on structured-financing conversations through the window that’s still open.
The deeper signal: SaaS as a category is in active structural transformation. The transformation may take 18-36 months to resolve. Each quarterly earnings cycle through 2026-2027 produces incremental data on whether the per-seat-to-consumption transition is durable or destructive to category economics. Q3 2026 is one data point in a longer arc; it matters more than most because it follows the Q1 baseline directly and provides the first comparable.
The bifurcation established in the continual-learning research map dispatch — frontier capability advancing on parameter/compute timeline, agentic capability advancing on slower architectural timeline — connects directly to the SaaS earnings story. The companies that capture the agentic deployment wave do so partly because the underlying capability advancement is real; the companies that miss do so partly because they bet on agentic deployment outrunning the actual capability ceiling. Q3 reveals which incumbents read the capability arc accurately.
Q3 2026 SaaS earnings is the litmus test for the agentic-disruption thesis at scale. Four metrics matter: non-seat share, AWU growth, $1M+ ACV count, RDR. Six companies report. Three scenarios on the table. The data resolves through July-August. The category-level repricing continues through 2027.
About the Author
Thorsten Meyer is a Munich-based futurist, post-labor economist, and recipient of OpenAI’s 10 Billion Token Award. He spent two decades managing €1B+ portfolios in enterprise ICT before deciding that writing about the transition was more useful than managing quarterly slides through it. More at ThorstenMeyerAI.com.
Related Dispatches
- The Anthropic-Blackstone-Goldman JV Structure — reverse-engineered $1.5B
- The Continual Learning Research Map — where the Memento Constraint stands
- The China Sphere Capability Gap Q2 Update — five labs, narrowing frontier
- The Skills Marketplace Six Months Later — predicted vs actual
- Forward-Deployed Engineer Economics 2.0 — the unit economics math
- The SaaSpocalypse — AI-agent-driven disruption of SaaS valuations
Sources
- ServiceNow Q1 2026 Form 8-K (April 22, 2026) — subscription revenue, AI ACV guidance, Now Assist customer growth
- Bill McDermott (ServiceNow CEO) — 50% non-seat share disclosure, AI ACV $1.5B target
- Salesforce Q4 FY26 Form 8-K — Agentforce ARR $800M, AWU 2.4 billion, +57% Q/Q
- Salesforce restated-segments announcement (May 2026) — Agentforce Apps $26.7B, Data 360/Platform $12.7B
- HuMai Blog — ServiceNow’s 18% Crash After A Beat, Explained
- Fortune — ServiceNow’s strong earnings fail to shift AI-driven anti-SaaS vibes
- 24/7 Wall St. — ServiceNow and Salesforce Fall 5% — March 24, 2026 sector context
- UC Today — ServiceNow Q1 2026 earnings analysis · AI momentum
- Futurum — Salesforce Q1 FY26 earnings analysis
- TS2.tech — Salesforce restated-segments coverage
- FinancialContent — Software’s Spring Awakening: ServiceNow Leads AI-Driven Sector Recovery (April 7, 2026)