By Thorsten Meyer — April 2026
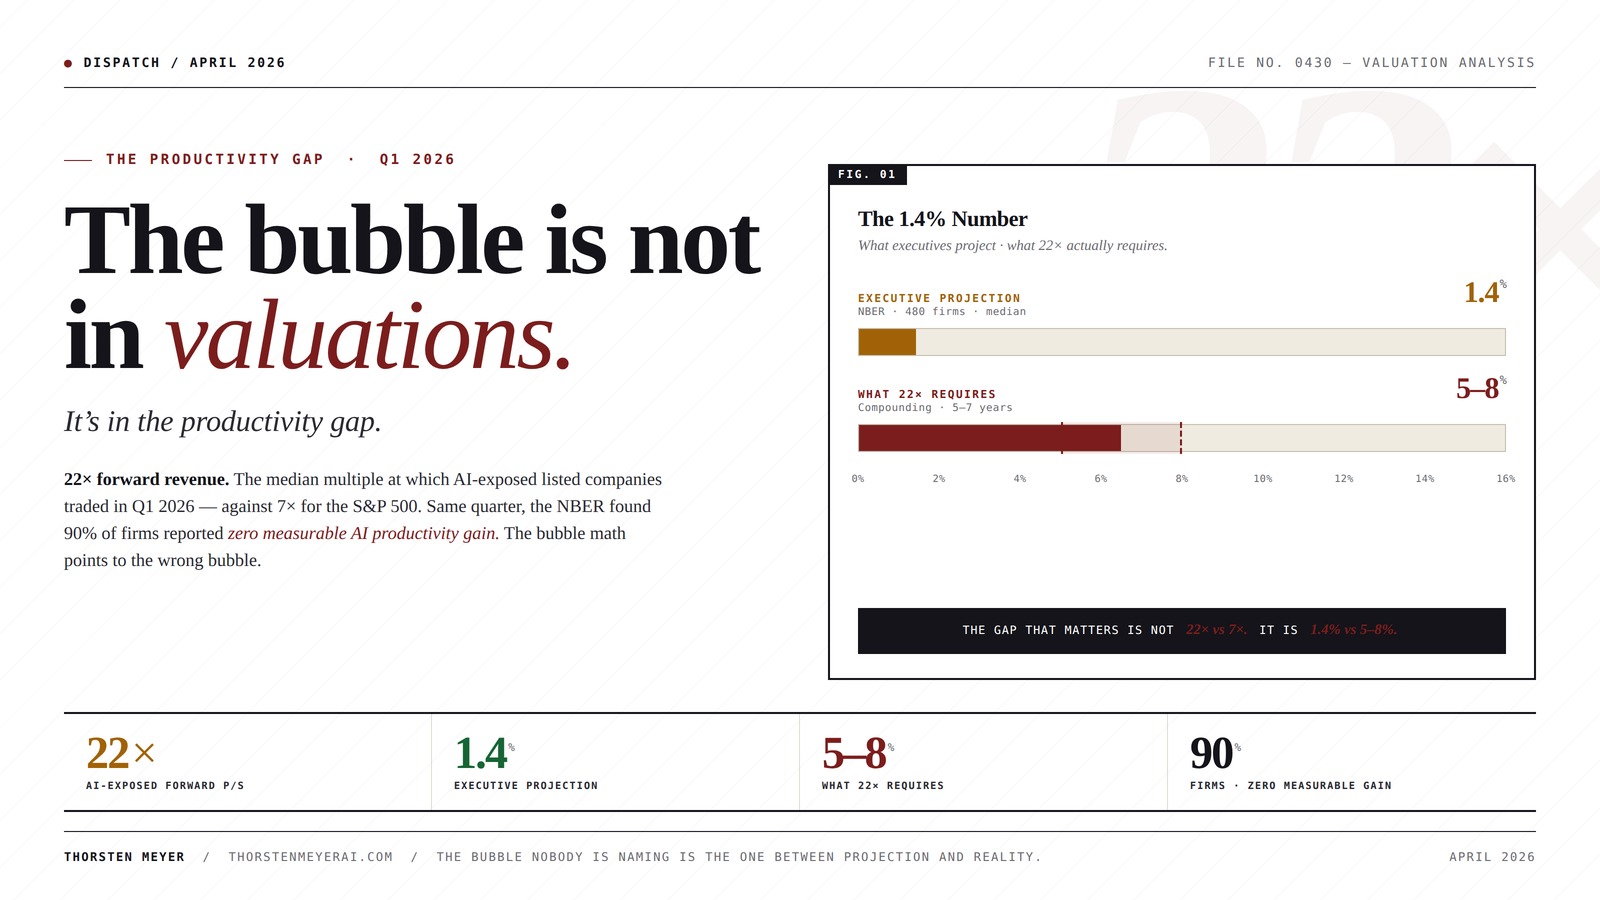
22× forward revenue. That is the median multiple at which AI-exposed listed companies traded in Q1 2026 — against 7× for the S&P 500. Palantir entered the year at a price-to-sales ratio above 100; Q1 closed at 86.
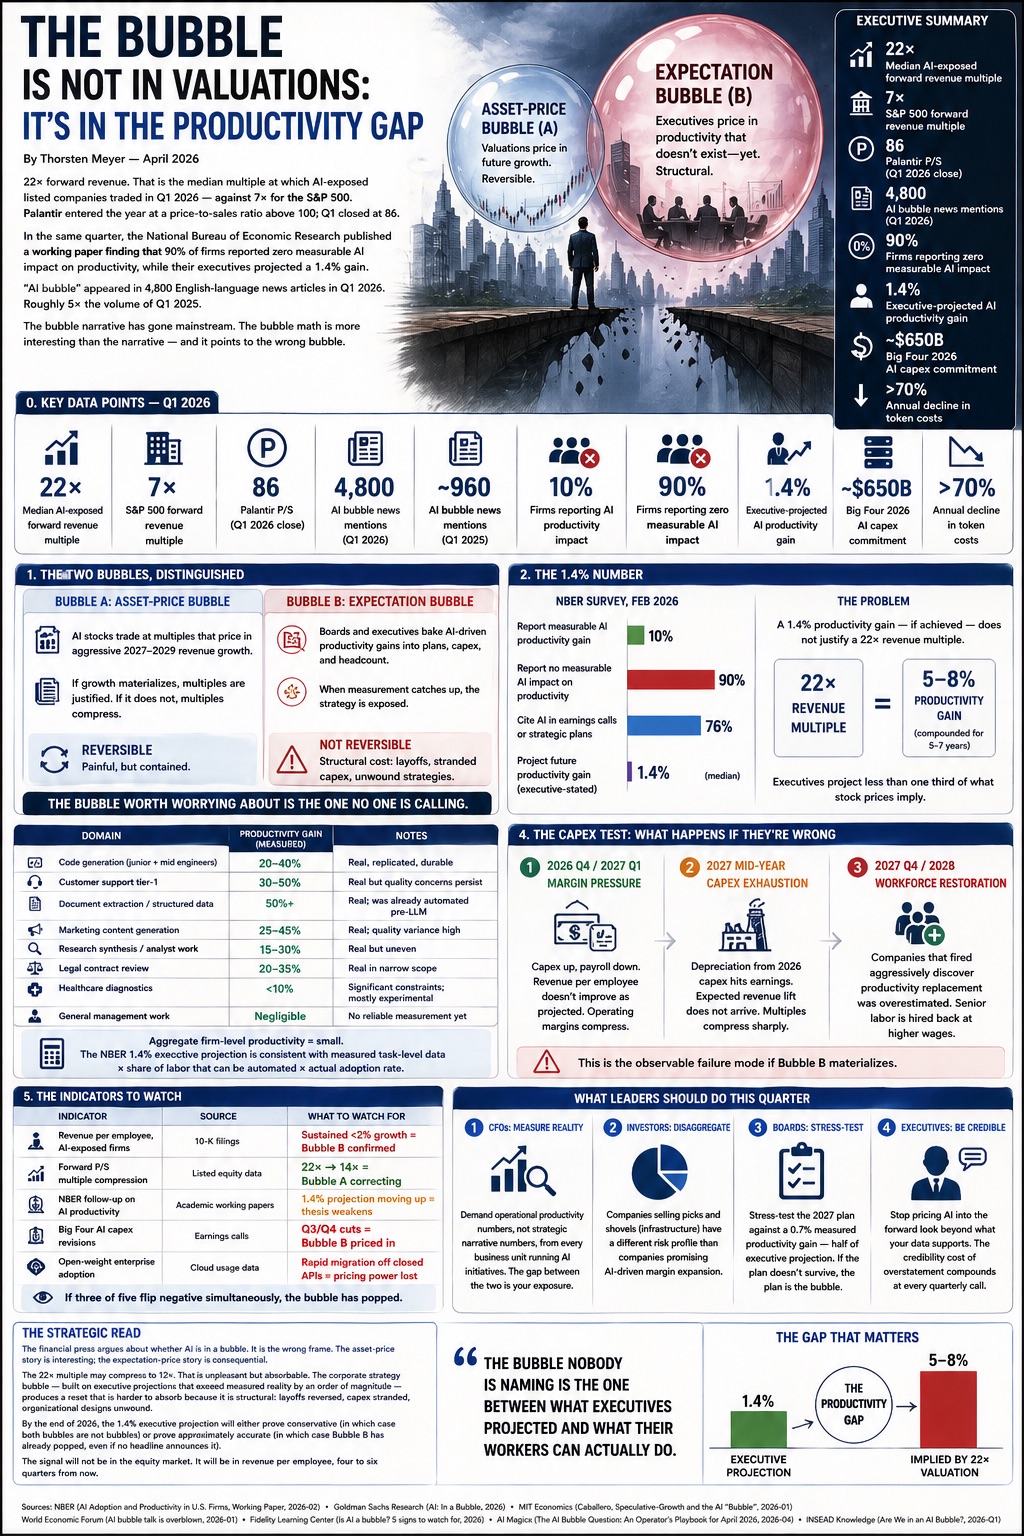
In the same quarter, the National Bureau of Economic Research published a working paper finding that 90% of firms reported zero measurable AI impact on productivity, while their executives projected a 1.4% gain.
“AI bubble” appeared in 4,800 English-language news articles in Q1 2026. Roughly 5× the volume of Q1 2025.
The bubble narrative has gone mainstream. The bubble math is more interesting than the narrative — and it points to the wrong bubble.
The bubble is not in valuations.
It’s in the productivity gap.
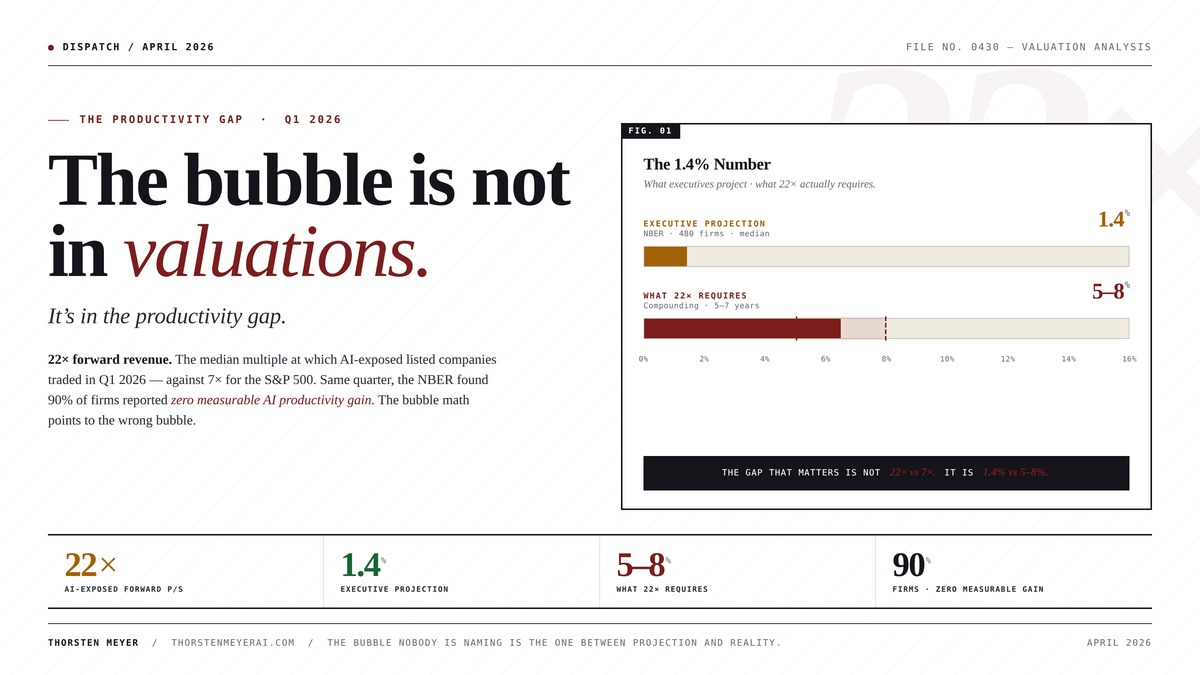
22× forward revenue. That is the median multiple at which AI-exposed listed companies traded in Q1 2026 — against 7× for the S&P 500. In the same quarter, the NBER published a paper finding 90% of firms reported zero measurable AI impact on productivity, while their executives projected a 1.4% gain. The bubble math is more interesting than the bubble narrative — and it points to the wrong bubble.
The financial press conflates them. They are not the same shape.
There are two bubble candidates in AI right now. One is reversible and contained. The other is structural — and no one is calling it.
Asset-price bubble.
- DriverMultiples priced for 2027–29 growth
- FailureMultiples compress; investors take losses
- ResetMarket re-prices, often within quarters
- CostPainful — but contained
Expectation bubble.
- DriverCapex, layoffs, org redesign priced on unmeasured productivity
- FailureMeasurement catches up; the strategy is exposed
- ResetLayoffs reversed, capex stranded, designs unwound
- CostStructural — not financial

Plaud Note Pro AI Voice Recorder Transcribe & Summarize for Meetings Calls
- High-Accuracy Transcription: Supports 112 languages with speaker labels
- Instant Structured Summaries: Creates mind maps, To-Do lists, proposals
- Multimodal Input Capture: Record audio, add images, type notes
As an affiliate, we earn on qualifying purchases.
As an affiliate, we earn on qualifying purchases.
Executives are projecting less than a third of what their stock prices imply.
A 1.4% productivity gain — if achieved — does not justify a 22× revenue multiple. The valuation premium implies a 5–8% gain compounding for 5–7 years. Either executives are managing expectations downward, or they cannot see what the market has priced in. Both readings are uncomfortable.

AI for Data Analytics: A Practical Guide to Applying Machine Learning and Generative AI for Better Decisions
As an affiliate, we earn on qualifying purchases.
As an affiliate, we earn on qualifying purchases.
AI does deliver. In narrow categories.
Aggregate across all roles in the firm — code, support, content, management, healthcare — and the firm-level productivity gain is small. That arithmetic is exactly the 1.4% the executives projected.

AI for Project Managers: A Desk Reference & Field Guide: Use Artificial Intelligence to Streamline Workflows, Automate Tasks, and Make Smarter Decisions with Practical Tools and Ethical Insights
As an affiliate, we earn on qualifying purchases.
As an affiliate, we earn on qualifying purchases.
If executives are wrong, three things happen in sequence.
$650B was committed by Amazon, Meta, Google, and Microsoft for 2026 AI capex. The bet is rational only if the productivity gains arrive. If they do not — this is what the next eight quarters look like.
2027 Q1
i.Margin pressure.
Companies that increased capex while cutting payroll find that revenue per employee did not improve as projected. Operating margins compress. The first quarterly tells.
MID-YEAR
ii.Capex pull-forward exhaustion.
The depreciation tail from the 2026 buildout hits earnings. The expected revenue lift does not arrive. Multiples compress sharply for the most exposed names. Bubble A pops first.
2028
iii.Workforce restoration.
Companies that fired aggressively under the AI narrative discover the productivity replacement was overestimated. Senior labor is hired back at higher wages. The bargaining power dynamic anticipated in earlier post-labor analyses arrives sooner than expected. Bubble B pops here — and the bill is structural.
The 22× multiple may compress to 12×. That is unpleasant but absorbable. The corporate strategy bubble — built on executive projections that exceed measured reality by an order of magnitude — produces a reset that is structural.

AI-Driven Software Testing: Transforming Software Testing with Artificial Intelligence and Machine Learning
As an affiliate, we earn on qualifying purchases.
As an affiliate, we earn on qualifying purchases.
If three of five flip negative simultaneously, the bubble has popped.
Four assignments. By role.
Demand operational numbers, not strategic narrative numbers.
From every business unit running AI initiatives. The gap between operational productivity and strategic narrative is your exposure — and it is reportable on Q3.
Disaggregate AI exposure.
Companies selling picks and shovels — NVIDIA, energy infrastructure, hyperscalers — have a different risk profile than companies promising AI-driven margin expansion. Bucket the holdings accordingly.
Stress-test the 2027 plan against 0.7%.
Half of the executive projection. If the plan does not survive a 0.7% measured productivity gain, the plan is the bubble — not an input to it.
Stop pricing AI into the forward look beyond what your data supports.
The credibility cost of overstatement compounds at every quarterly call. The honest 1.4% is a stronger long-term position than the projected 5%.
Executive Summary
| Metric | Q1 2026 |
|---|---|
| Median AI-exposed forward revenue multiple | 22× |
| S&P 500 forward revenue multiple | 7× |
| Palantir P/S (Q1 2026 close) | 86 |
| AI bubble news mentions (Q1 2026) | 4,800 |
| AI bubble news mentions (Q1 2025) | ~960 |
| Firms reporting AI productivity impact (NBER) | 10% |
| Firms reporting zero measurable AI impact | 90% |
| Executive-projected AI productivity gain | 1.4% |
| Big Four 2026 AI capex commitment | ~$650B |
| Annual decline in token costs | >70% |
The valuation premium is defensible if AI delivers what executives say it will. The 1.4% executive projection is itself far below what the valuation premium requires. The gap that matters is not 22× vs 7×. It is the gap between executive expectation and measured reality.
1. The Two Bubbles, Distinguished
There are two distinct bubble candidates in AI right now. The financial press conflates them.
Bubble A — Asset-price bubble. AI stocks trade at multiples that price in aggressive 2027–2029 revenue growth. If the growth materializes, the multiples are justified. If it does not, multiples compress. This is a normal market dynamic.
Bubble B — Expectation bubble. Boards, executives, and management consultants have priced AI into operating assumptions, capex plans, and headcount strategies on the basis of productivity gains that have not yet been measured. When the measurement catches up, the strategy is exposed.
Bubble A is reversible. Stocks compress; investors take losses; markets re-price. Painful but contained.
Bubble B is not. By the time measurement catches up, layoffs have happened, capex has been spent, organizational redesigns completed, alternative paths foreclosed. The cost of Bubble B is structural, not financial.
The bubble worth worrying about is the one no one is calling.
2. The 1.4% Number
The NBER working paper (February 2026) sampled 480 firms across 12 sectors. The headline numbers:
| NBER Survey, Feb 2026 | % of Firms |
|---|---|
| Report measurable AI productivity gain | 10% |
| Report no measurable AI impact on productivity | 90% |
| Cite AI in earnings calls or strategic plans | 76% |
| Project future productivity gain (executive-stated) | 1.4% (median) |
The 76% / 10% gap is the corporate communications problem. The 1.4% number is the financial problem.
A 1.4% productivity gain — if achieved — does not justify a 22× revenue multiple. The valuation premium implies a 5–8% productivity gain compounding for 5–7 years. Executives are publicly asking for, and projecting, less than a third of what their stock prices imply.
Either the executives are managing expectations downward, or they cannot see what the market has priced in. Both readings are uncomfortable. Neither supports the multiple.
3. Where the Productivity Is Real (and Where It Is Not)
To be precise: AI is delivering measurable productivity gains in narrow categories.
| Domain | Productivity Gain (Measured) | Notes |
|---|---|---|
| Code generation (junior + mid engineers) | 20–40% on routine tasks | Real, replicated, durable |
| Customer support tier-1 | 30–50% in handle time | Real but quality concerns persist |
| Document extraction / structured data | 50%+ | Real; was already automated pre-LLM |
| Marketing content generation | 25–45% time-to-draft | Real; quality variance high |
| Research synthesis / analyst work | 15–30% | Real but uneven |
| Legal contract review | 20–35% (selected tasks) | Real in narrow scope |
| Healthcare diagnostics | <10% | Significant constraints; mostly experimental |
| General management work | Negligible | No reliable measurement yet |
Aggregate across an enterprise — across all roles — and the firm-level productivity number is small. The NBER 1.4% executive projection is broadly consistent with the measured task-level data, divided by the share of total labor that can be automated, multiplied by the actual adoption rate.
Token costs falling 70% per year does not change this arithmetic. Cheaper inputs do not create demand for outputs the workflow does not yet support.
4. The Capex Test
If executives are correct that AI will eventually deliver large productivity gains, the $650B capex bet is rational.
If they are wrong, three things happen, in sequence:
- 2026 Q4 / 2027 Q1: Margin pressure. Companies that increased capex while cutting payroll find that revenue per employee did not improve as projected. Operating margins compress.
- 2027 mid-year: Capex pull-forward exhaustion. The depreciation tail from the 2026 capex hits earnings. The expected revenue lift does not arrive. Multiples compress sharply for the most exposed names.
- 2027 Q4 / 2028: Workforce restoration. Companies that fired aggressively under the AI narrative discover the productivity replacement was overestimated. Senior labor is hired back at higher wages. The bargaining power dynamic anticipated in earlier post-labor analyses arrives sooner than expected.
This is not a prediction. It is the observable failure mode if Bubble B materializes.
5. The Indicators to Watch
Five quarterly readings will tell you which bubble pops first, and when.
| Indicator | Source | What to Watch For |
|---|---|---|
| Revenue per employee, AI-exposed firms | 10-K filings | Sustained <2% growth = Bubble B confirmed |
| Forward P/S multiple compression | Listed equity data | 22× → 14× = Bubble A correcting |
| NBER follow-up on AI productivity | Academic working papers | 1.4% projection moving up = thesis weakens |
| Big Four AI capex revisions | Earnings calls | Q3/Q4 cuts = Bubble B priced in |
| Open-weight enterprise adoption | Cloud usage data | Rapid migration off closed APIs = pricing power lost |
If three of five flip negative simultaneously, the bubble has popped.
What Leaders Should Do This Quarter
1. CFOs: Demand operational productivity numbers, not strategic narrative numbers, from every business unit running AI initiatives. The gap between the two is your exposure.
2. Investors: Disaggregate AI exposure. Companies selling picks and shovels (NVIDIA, energy infrastructure, hyperscalers) have a different risk profile than companies promising AI-driven margin expansion.
3. Boards: Stress-test the 2027 plan against a 0.7% measured productivity gain — half of executive projection. If the plan does not survive that scenario, the plan is the bubble.
4. Executives: Stop pricing AI into the forward look beyond what your data supports. The credibility cost of overstatement compounds at every quarterly call.
The Strategic Read
The financial press has spent six months arguing about whether AI is in a bubble. It is the wrong frame. The asset-price story is interesting; the expectation-price story is consequential.
The 22× multiple may compress to 12×. That is unpleasant but absorbable. The corporate strategy bubble — built on executive projections that exceed measured reality by an order of magnitude — produces a reset that is harder to absorb because it is structural: layoffs reversed, capex stranded, organizational designs unwound.
By the end of 2026, the 1.4% executive projection will either prove conservative (in which case both bubbles are not bubbles) or prove approximately accurate (in which case Bubble B has already popped, even if no headline announces it).
The signal will not be in the equity market. It will be in revenue per employee, four to six quarters from now.
The bubble nobody is naming is the one between what executives projected and what their workers can actually do.
About the Author
Thorsten Meyer is a Munich-based futurist, post-labor economist, and recipient of OpenAI’s 10 Billion Token Award. He spent two decades managing €1B+ portfolios in enterprise ICT before deciding that writing about the transition was more useful than managing quarterly slides through it. More at ThorstenMeyerAI.com.
Sources
- AI Magicx, The AI Bubble Question: An Operator’s Playbook for April 2026 (2026-04)
- Goldman Sachs Research, AI: In a Bubble (2026)
- Motley Fool, Prediction: The AI Bubble Is Readying to Pop (2026-04-08)
- INSEAD Knowledge, Are We in an AI Bubble? (2026-Q1)
- NBER, AI Adoption and Productivity in U.S. Firms (Working Paper, 2026-02)
- World Economic Forum, AI bubble talk is overblown. AI can already perform $4.5 trillion in tasks (2026-01)
- MIT Economics (Caballero), Speculative-Growth and the AI “Bubble” (2026-01)
- Fidelity Learning Center, Is AI a bubble? 5 signs to watch for (2026)