
By Thorsten Meyer — May 2026
The “AI bubble” question has become unavoidable in May 2026. Sam Altman publicly stated in 2025 that he believes an AI bubble is ongoing. Jamie Dimon warned that “some AI money will be wasted” with a higher chance of meaningful stock drops. The IMF’s chief economist Pierre-Olivier Gourinchas warned that the AI investment surge “carries the risk of creating a technological bubble.” 54 percent of global fund managers told a Bank of America October 2025 survey that AI-related stocks were in “bubble territory.” David Cahn at Sequoia argued the data center buildout forecasted to 2030 can only be justified by AGI — a prerequisite that may not arrive on the required timeline. Yet the same period has seen real earnings growth from the Magnificent Seven, AI-driven productivity gains in genuine enterprise deployment, and structural advances in capability that the 1999 dotcom analog never produced.
Both framings — “AI is a bubble” and “AI is not a bubble” — are too simple to be useful. The intellectually honest analysis disentangles the question by category. Which specific AI investments show clear bubble dynamics, which show genuine durable value, and which sit in contested middle ground. The framing matters because the resolution path through 2027-2030 will be different across categories. Some bets correct sharply; some compound through a deployment cycle; some persist as durable infrastructure regardless of near-term price action.
This dispatch is the disentanglement. The categories. The 1999 echoes that are real and the ones that are not. The Carlota Perez installation-vs-deployment framing applied to current data. Three scenarios for how the bubble question resolves through 2027-2030. The strategic implications for investors, founders, customers, and policymakers who need to position across the durable-vs-bubble distinction rather than against the entire AI cycle.
The dispatch on the $725B hyperscaler capex flagged the impairment risk vector explicitly. The dispatch on the power bottleneck covered the infrastructure constraint that compounds the impairment risk. The dispatch on the China Sphere capability gap covered the price compression that affects Western AI service economics. The dispatch on the Anthropic IPO disclosure covered the explicit margin-compression risk factors. The cumulative picture from these threads is the data foundation for the bubble question. This dispatch synthesizes them.
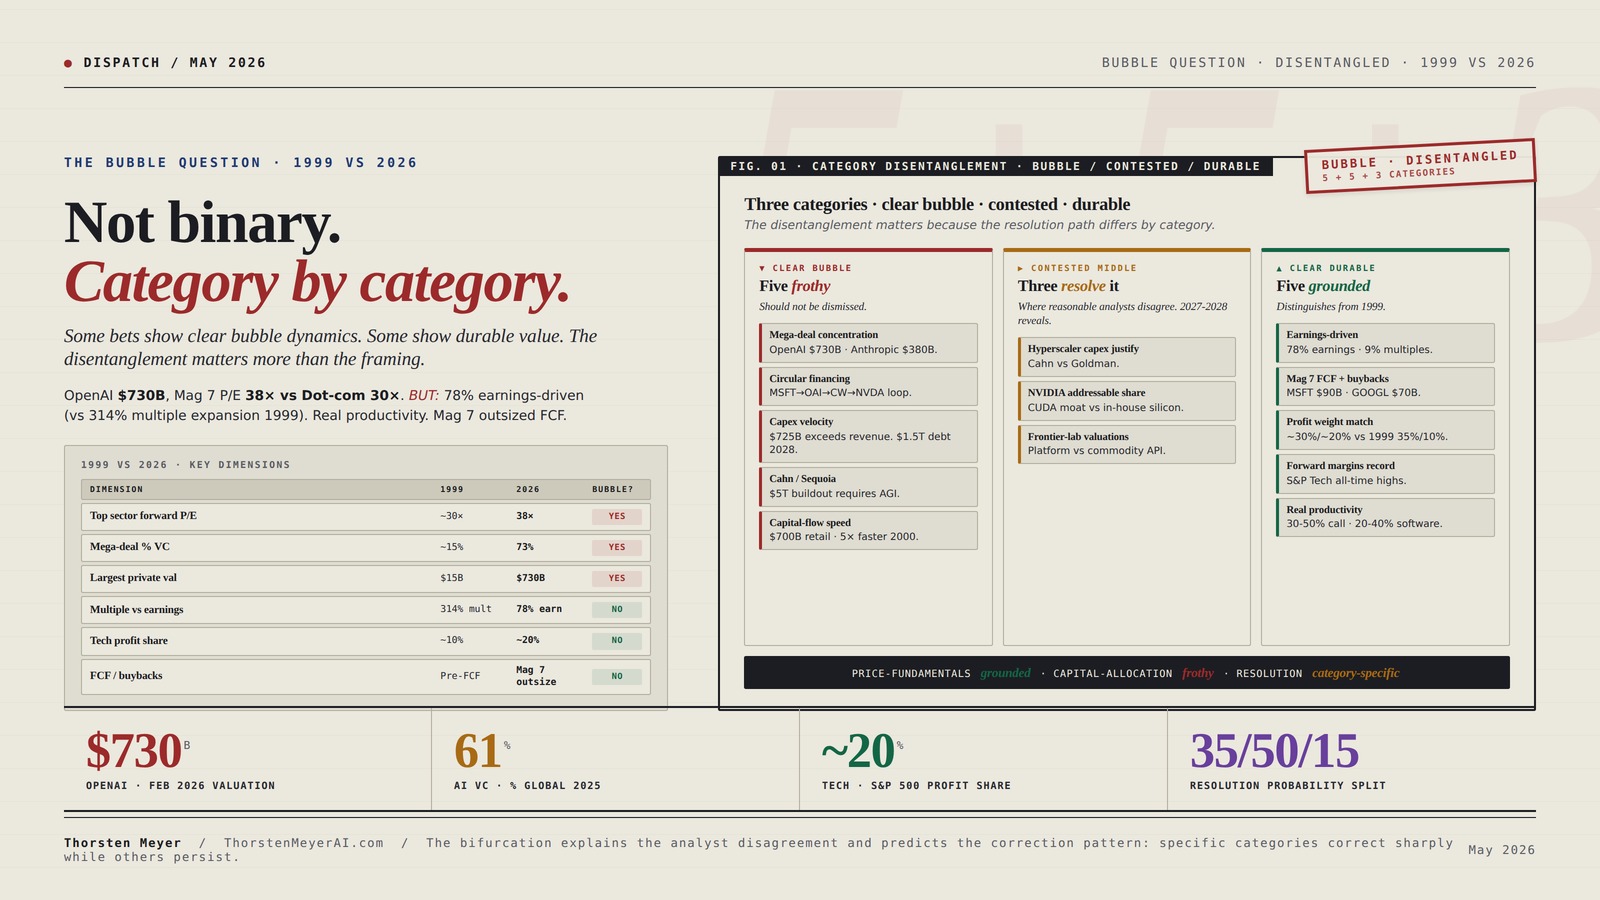
Not binary.
Category by category.
Some bets show clear bubble dynamics. Some show durable value. The disentanglement matters more than the aggregate framing.
OpenAI $730B private valuation. Anthropic $380B. Mag 7 forward P/E 38× vs Dot-com peak 30×. BUT: earnings-driven returns (78%) vs Dot-com multiple-driven (314%). Real productivity gains. Mag 7 outsized free cash flow. Carlota Perez framing applies.
Two cycles. Twelve dimensions.
On price-and-fundamentals dimensions, 2024-2026 is more grounded than 1999. On capital-allocation dimensions, 2024-2026 has bubble-comparable or worse characteristics. The dual signal explains the analyst disagreement.
Kingston Data Centre DC500M, SEDC500M/960G, Enterprise Drive a Stato Solido – SSD 2.5” 960 GB
- Predictable I/O Latency: Consistent performance across workloads
- Optimized for Mixed Workloads: Balanced read/write density
- Configurable Over-Provisioning: Customize storage performance
As an affiliate, we earn on qualifying purchases.
As an affiliate, we earn on qualifying purchases.
Five frothy. Five durable. Three contested.
The honest read: the cycle is structurally bifurcated. Some categories are not in bubble territory; others are. The contested middle is where the bubble question actually resolves through 2027-2028.
- Mega-deal concentrationOpenAI $730B, Anthropic $380B, Databricks $134B.
- Circular financingMSFT→OpenAI→CoreWeave→NVDA→MSFT loop.
- Capex velocity$725B exceeds revenue translation. $1.5T debt by 2028.
- Cahn / Sequoia argument$5T buildout requires AGI by 2030.
- Capital-flow speed$700B retail equity since Jan · 5× faster than 2000.
- Hyperscaler capex justificationCahn (only AGI) vs Goldman (justified by trajectory).
- NVIDIA addressable shareCUDA moat vs in-house silicon migration to 30-45% by 2028.
- Frontier-lab valuationsPlatform companies vs commodity API providers.
- Earnings-driven returns78% earnings · 9% multiples vs Dot-com 314% multiples.
- Mag 7 FCF + buybacksMicrosoft $90B FCF · Alphabet $70B · structural cushion.
- Profit weight matchesTech ~30% market cap, ~20% profits vs 1999 35%/10% gap.
- Forward margins recordS&P Tech margin estimates at all-time highs.
- Real productivity30-50% call center · 20-40% software eng · measurable today.

Opengear OM2248-10G Infrastructure Management Equipment
- Autosensing Capability: Highly responsive autosensing feature
- Caller ID Support: Supports various caller ID formats
As an affiliate, we earn on qualifying purchases.
As an affiliate, we earn on qualifying purchases.
Three paths. One question.
35/50/15 probability. Base scenario most likely because durable-value supports prevent worst-case but bubble signals are too strong to resolve without correction.
- Frothy correct 30-50%Frontier labs, circular financing.
- Mag 7 sustainsReal productivity continues.
- Hyperscaler capex defensibleMixed but justified.
- NVIDIA gradual decelNot sharp.
- Outcome: Uneven returns. Big winners + losers. No broad crash.
- Frontier labs -40-60%From 2026 peaks.
- Hyperscaler impair$50-150B capex aggregate.
- NVIDIA sharp decelFY28 30-50% growth vs FY26 75%.
- NASDAQ -30-50%12-24 month period.
- Outcome: Mag 7 cushion holds. Deployment continues delayed.
- NASDAQ -60-78%Matching 2001-2003 magnitude.
- Frontier labs collapseBelow VC entry pricing.
- Hyperscaler impair $300-500BMajor capex writedowns.
- NVIDIA negative quartersRevenue compression.
- Outcome: Multi-year recovery. Deployment 2032-2033.
The 2024-2026 cycle is structurally more grounded than 1999 on price-and-fundamentals dimensions and structurally similar or worse on capital-allocation dimensions. The bifurcation explains the analyst disagreement and predicts the correction pattern: specific categories correct sharply while others persist.

VEVOR 12U Open Frame Server Rack, 23-40 in Adjustable Depth, Free Standing or Wall Mount Network Server Rack, 4 Post AV Rack with Casters, Holds All Your Networking IT Equipment AV Gear Router Modem
- Adjustable Depth: 23-40 inches for versatile equipment fit
- High Load Capacity: 500 lbs ground, 150 lbs wall-mounted
- Durable Carbon Steel Construction: Ensures strength and weldability
As an affiliate, we earn on qualifying purchases.
As an affiliate, we earn on qualifying purchases.
Four assignments. By role.
Stop pricing AI as single asset class.
Differentiate Mag 7 (durable-value-leaning) from pure-play AI infrastructure (bubble-leaning) from contested middle (NVIDIA, frontier labs). Position long durable-value categories; short or underweight bubble-categories with circular-financing exposure. Use Perez framing to size correction expectations.
Pace through 2026-2027.
Preserve dry powder for 2028-2029. Mega-rounds at $300B+ valuations carry asymmetric correction risk. Mid-stage product-market-fit names with real revenue carry durable value through any plausible correction. The 1999 lesson: winners eventually recover; losers don’t.
Build for survivable correction.
18-24 month cash runway assumptions that survive 30-50% valuation correction. Prioritize real revenue over narrative-driven funding. Structure cap tables to absorb down-round scenarios. Peak-fundraising window of 2025-2026 may not persist; raise opportunistically while it does.
Multi-vendor sourcing for price volatility.
Plan for AI service price volatility through 2027-2028. Prices may rise (power constraint) or fall (frontier-lab competitive pressure). Multi-vendor sourcing reduces single-vendor exposure. Contractual flexibility (escalators, exit provisions, renegotiation triggers) preserves optionality.

Data Center Power And Cooling Technologies A Complete Guide – 2019 Edition
As an affiliate, we earn on qualifying purchases.
As an affiliate, we earn on qualifying purchases.
Executive Summary · The Comparison in One Table
| Dimension | 1999 / 2000 dotcom | 2024 / 2026 AI | Bubble signal? |
|---|---|---|---|
| Top sector forward P/E | Tech sector ~30× | Mag 7 ~38× | Yes — higher |
| Tech as % S&P market cap | ~35% (peak March 2000) | ~30% | Approaching |
| Tech as % S&P profits | ~10% (mismatch) | ~20% | No — supported |
| VC concentration | 62% of $54B in unprofitable cos | 61% of $258.7B AI startups | Higher absolute, similar concentration |
| Mega-deal share of VC | ~15% | 73% of AI VC | Yes — extreme concentration |
| Largest private valuation | ~$15B (Pets.com peak) | OpenAI $730B / Anthropic $380B | Yes — orders of magnitude |
| Key cap-X commitment | Telecom $500B | AI infrastructure $725B in 2026 alone | Comparable scale, faster pace |
| Multiple expansion vs earnings (2021-25) | 314% / 488% from multiples (1995-99) | 78% earnings · 9% multiples | No — different driver |
| Free cash flow / buybacks | Most leaders pre-FCF | Mag 7 generating outsized FCF + buybacks + dividends | No — supported |
| Circularity in financing | Vendor financing (Cisco, Lucent) | MSFT → OpenAI → CoreWeave → NVIDIA → MSFT | Yes — analogous |
| Revenue / hype timing | Most companies pre-revenue | Real revenue at scale | No — different dynamic |
| Productivity gains in real economy | Eventually, after crash | Already showing in margins | No — already realized |
The pattern that emerges: on price-and-fundamentals dimensions, the 2024-2026 AI cycle is more grounded than 1999. Multiple expansion has played a smaller role; earnings growth has played a larger role. Real revenue exists. Productivity gains are visible. On capital-allocation dimensions, the 2024-2026 cycle has bubble-comparable or worse characteristics. Mega-deal concentration is extreme. Private valuations are orders of magnitude above 1999 peaks. Circular financing patterns are visible. The dual signal explains the analyst disagreement: people looking at price-and-fundamentals see “not a bubble”; people looking at capital-allocation see “obvious bubble.”
The honest read: the cycle is structurally bifurcated. Some categories are not in bubble territory; others are. The disentanglement matters more than the aggregate framing.
1. The 1999 reference, briefly
The dotcom bubble’s structural features matter for the comparison.
Capital deployment scale. US venture capital deployed $54 billion in 1999, with 62 percent flowing to unprofitable companies. NASDAQ saw 442 IPOs in 2000 alone — many at valuations untethered from any traditional financial-modeling logic. The valuation premise: “first mover advantage” + “land grab” + “future revenue from network effects” = present-day market cap that traditional discounted-cash-flow analysis could not justify.
The categorical failure. When the bubble burst, both genuinely durable companies (Amazon, Cisco, Sun Microsystems) and unsustainable companies (Pets.com, Webvan, eToys) corrected sharply. Amazon stock declined approximately 90 percent peak-to-trough; Cisco approximately 88 percent; Sun Microsystems approximately 95 percent. Cisco’s forward P/E reached 472× at peak — the most-quoted valuation excess of the era. The companies that survived (Amazon, Cisco) eventually returned to and exceeded their peak valuations; the companies that failed never did.
The structural insight. The dotcom crash did not mean the internet failed. The crash meant the financial system outran the real economy. By 2010, internet penetration had grown from 16 percent (2000) to over 60 percent globally; the productivity and revenue gains the bubble priced in eventually arrived, but on a 5-10 year delayed timeline. Carlota Perez, the economist who studied technological revolutions, called this pattern the “installation phase” (speculative capital racing ahead of deployment) followed by a crash and then a “deployment phase” (the technology reshaping society at sustainable economics). Canals, railways, electricity, internet — all followed this arc.
The reference matters because the question for 2026 is whether AI follows the same arc on similar timelines, follows the arc on different timelines, or follows a structurally different pattern.
2. The bubble-dynamics evidence · what’s clearly frothy
Five categories show bubble-like dynamics that should not be dismissed.
Category 1 · Mega-deal concentration in AI VC. AI startups captured $258.7 billion in 2025 VC per OECD data — 61 percent of all global VC investment. Top 5 deals alone accounted for ~$63 billion (25 percent of total). Mega-deals comprised 73 percent of total AI VC value. The concentration is structurally analogous to 1999 venture capital concentration in dotcom names but at higher absolute scale. OpenAI closed a $110 billion funding round in February 2026 at a $730 billion pre-money valuation — the largest private funding round in history. Anthropic raised $30 billion at a $380 billion valuation in the same month. Databricks reached $134 billion valuation by early 2026 (more than doubled from its 2024 “peak AI bubble” framing). These valuations require revenue growth scenarios that may or may not materialize.
Category 2 · Circular financing in the AI ecosystem. Microsoft invested ~$13.5B in OpenAI; OpenAI buys compute from Microsoft Azure (revenue back to Microsoft). Microsoft also has compute relationships with CoreWeave (which leases NVIDIA GPUs financed partly by Microsoft equity stakes). NVIDIA invested in CoreWeave and OpenAI; OpenAI buys NVIDIA hardware through Azure. The same dollar circulates through multiple balance sheets and is counted as revenue or asset value at multiple stages. Yahoo Finance noted: “AI companies are now investing in themselves — a self-reinforcing feedback loop where narrative creates valuation, and valuation fuels narrative.” The pattern echoes vendor financing in the 1999 telecom buildout (Cisco / Lucent / Nortel financing customer purchases that fed back into their own revenue) — which contributed substantially to the magnitude of the 2001-2003 telecom impairment cycle.
Category 3 · Hyperscaler capex velocity exceeding revenue translation. The $725B capex dispatch covered this directly. $725B 2026 commitment requires AI revenue growth of approximately $360-600B annually to justify the depreciation schedule (3-5× depreciation rule). Current AI revenue across the Big Four is meaningfully below that threshold. The bridge from current AI revenue to required AI revenue depends on enterprise deployment scaling, agentic AI adoption, and new application categories (robotics, autonomous, scientific computing) materializing on the projected timeline. Each of these is uncertain. Analysts project $1.5 trillion cumulative data center / AI infrastructure debt by 2028. Goldman Sachs estimated a sharp correction could erase $30-40 trillion in NASDAQ market value if sentiment shifts.
Category 4 · The Sequoia / David Cahn argument. David Cahn at Sequoia Capital published an October 2025 analysis arguing that the only way to justify the massive data center buildout forecasted by 2030 — which he estimated would cost approximately $5 trillion in cumulative capex through that horizon — is the arrival of AGI. AGI by 2030 is uncertain at best. Without AGI, the buildout produces revenue insufficient to justify the capex, triggering impairment cycles. The argument is structurally valid; whether it produces a bubble-burst depends on whether AGI arrives, on the timeline of the required revenue acceleration, and on the rate at which capacity comes online versus demand absorption.
Category 5 · Speed of capital flows vs sustainable fundamentals. Morgan Stanley estimated that US retail investors funneled more than $700 billion into equities since January 2026 — five times faster than during the 2000 bubble peak. Rob Arnott observed: “the narrative was correct, but the market bet that narrative would play out a lot faster than it ultimately did.” The mismatch between capital-flow speed and fundamental-realization speed is a classic late-stage-bull-market signal.
The five categories collectively represent the “obvious bubble” face of the 2024-2026 AI cycle. The signals are real and shouldn’t be dismissed. The question is whether they characterize the entire cycle or only specific categories within it.
3. The durable-value evidence · what’s clearly grounded
Five categories show genuine durable-value characteristics that distinguish 2024-2026 from 1999.
Category 1 · Earnings-driven returns rather than multiple expansion. From 1995-1999 (dotcom), the S&P 500 Technology sector’s 488 percent total return was driven approximately 314 percent by multiple expansion, 171 percent by earnings growth, 3 percent by dividends. From 2021-2025 (AI cycle), the same sector’s 92 percent total return was driven approximately 78 percent by earnings growth, 9 percent by multiple expansion, 5 percent by dividends. The current cycle’s gains are predominantly earnings-driven; 1999’s gains were predominantly multiple-driven. The structural distinction matters because earnings-driven gains have stronger fundamental support than multiple-driven gains.
Category 2 · Mag 7 free cash flow, buybacks, and dividends. Most 1999 leaders were pre-cash-flow. Most 2024-2026 leaders generate enormous free cash flow, return capital through buybacks, pay dividends. Microsoft generates approximately $90B annual free cash flow and returns ~$30B through buybacks. Alphabet ~$70B FCF / ~$30B buybacks. Amazon ~$50B FCF. Meta ~$50B FCF / ~$40B buybacks. These are the structural opposite of the dotcom-era leaders. The financial cushion provides a buffer that 1999 leaders lacked.
Category 3 · Tech sector market cap vs. profit weight. During the 1999-2000 peak, the S&P 500 Technology sector reached ~35 percent market cap weight while contributing ~10 percent of profits — a structural mismatch that the 2001-2003 correction resolved. In 2024-2026, the Tech sector reaches ~30 percent market cap weight while contributing ~20 percent of profits — a much smaller mismatch. The price-vs-profit gap is real but materially smaller than 1999.
Category 4 · Forward earnings margins at record levels. S&P 500 Technology sector one-year-forward estimated margins are at record levels in 2025-2026, with 6-month revisions in those estimates comparable to changes last seen following the 2009 market low. Margin expansion provides earnings tailwind that supports valuations. Most 1999 leaders did not have margin expansion as a tailwind — they were chasing top-line growth at thin or negative margins.
Category 5 · Real productivity gains in deployed AI. Unlike prior technology waves that primarily created new products, AI is directly improving worker efficiency across industries. Customer service automation showing 30-50 percent productivity gains in deployed call centers. Software engineering deployment (Cursor, Claude Code, GitHub Copilot) producing 20-40 percent productivity gains for adopting teams. Sales automation, content generation, and analytics workflows all showing measurable productivity uplifts. McKinsey projects 1.5 percent annual US GDP boost from AI by 2030. The productivity gains are real, deployed, and measurable — distinct from 1999’s “future productivity” thesis that took 5-10 years to materialize.
The five categories represent the “not a bubble” face of the cycle. The signals are also real. The question is whether they offset the bubble signals from category 1 or whether they coexist with bubble dynamics in different specific bets.
4. The contested middle · where the disagreement is sharpest
Three categories sit in contested middle ground where reasonable analysts disagree.
Category 1 · Hyperscaler capex justification. Cahn (Sequoia) argues only AGI can justify it; Goldman Sachs analysts (Sheridan, Rangan, Oppenheimer, Hammond) argue the capex is justified by current and emerging revenue trajectories. The disagreement reflects genuine uncertainty about: how fast enterprise AI adoption scales, whether agentic AI deployment produces meaningful incremental compute demand, whether robotics deployment scales as the bullish case requires, and whether new application categories materialize on schedule. The disagreement is not analytical sloppiness — it is genuine forward-looking uncertainty. The data through 2027-2028 will resolve which side was correct.
Category 2 · Specific NVIDIA addressable share. NVIDIA has been the dominant beneficiary of the buildout. The question is whether its addressable share holds through 2028-2030 or compresses through hyperscaler in-house silicon migration (Google TPU, Amazon Trainium/Inferentia, Microsoft Maia, Meta MTIA). Bull case: NVIDIA’s CUDA moat and architectural lead persist; addressable share holds at 70-80 percent of hyperscaler AI capex. Bear case: in-house silicon scales to 40-50 percent of inference workload by 2028; NVIDIA’s addressable share compresses to 50-60 percent. The disagreement reflects genuine uncertainty about software-stack stickiness and hardware-design parity.
Category 3 · Frontier-lab valuation justification. OpenAI $730B and Anthropic $380B valuations require revenue growth scenarios that may or may not materialize. Bull case: the labs are platform companies whose revenue scales with the entire AI economy; comparable to Microsoft / Apple / Amazon at similar revenue scale. Bear case: the labs are commodity-providers facing structural margin compression from China sphere price competition (covered in the Q2 update dispatch) and from hyperscaler-direct alternatives (Azure OpenAI Service, AWS Bedrock, Google Vertex AI). The disagreement reflects genuine uncertainty about whether frontier labs become Microsoft-scale platforms or commodity-tier API providers.
The contested middle is the most analytically interesting category because it is where the bubble question actually resolves. If hyperscaler capex turns out to be justified (Cahn wrong), if NVIDIA addressable share holds (in-house silicon migration slower than expected), if frontier labs become platforms (Anthropic/OpenAI valuation justified) — then the bubble framing is wrong on the most important specific bets. If the opposite, the bubble framing is right on those specific bets even while other categories (Mag 7, real productivity) remain durable.
5. The Carlota Perez framing applied
Perez’s installation-vs-deployment framing applied to AI 2024-2026.
Where we are on the cycle. Multiple historical analogs (canals 1830s, railways 1840s/1870s, electricity 1880s/1920s, internet 1995-2000) follow the same pattern: speculative installation phase → crash → deployment phase → mature integration. The installation phase is characterized by frenzied capital deployment, technology installation that exceeds near-term demand, and extreme valuations on installation-phase players. The crash resolves the financial-system mismatch. The deployment phase produces the genuine economic transformation, often on 5-15 year timelines.
The 2024-2026 distinction. Unusually, AI deployment appears to be racing alongside the speculation rather than trailing it. Real enterprise AI deployment is happening now. Real productivity gains are measurable now. Real revenue is being generated at scale (Mag 7 AI revenue lines, hyperscaler AI infrastructure revenue, frontier lab API revenue). The structural difference from 1999: in 1999, most invested-in companies had little or no revenue; in 2024-2026, the invested-in companies have real revenue that is growing rapidly. The bubble dynamics coexist with real deployment dynamics.
What this implies for the cycle resolution. Two possibilities. First: the bubble dynamics correct (specific frothy categories impair) while the deployment continues durably — a “soft landing” where some bets fail but the underlying technology continues advancing on its real-world adoption curve. Second: the bubble dynamics force a broader correction (analogous to 2001-2003) that drags the deployment-phase trajectory down with it temporarily, before the deployment phase resumes on slightly delayed timeline.
Historical base rates. Across the historical analogs, deep multi-year corrections in the installation-phase capital have been the rule rather than the exception. 1873 railway crash (60-80 percent declines in railway names). 1929 electric utility crash (similar magnitude). 2001-2003 dotcom crash (78 percent NASDAQ peak-to-trough). The base-rate probability of a deep correction at some point in 2027-2030 is meaningful — perhaps 40-50 percent of any major technology cycle’s history. The probability of complete bubble-bust analogous to 2001-2003 is lower (perhaps 15-25 percent given the durable-value supports identified in Section 3) but not trivial.
The actionable distinction. The Perez framing suggests the question is not “is AI a bubble?” but “when does the installation phase peak and what’s the structure of the correction?” If installation phase peaks 2026-2027 and corrects 30-50 percent in some categories, the deployment phase still produces enormous value through 2030+ — just on a slightly delayed timeline. If installation phase persists through 2028 before correcting, the correction is sharper but the deployment phase still arrives.
6. Three scenarios for resolution through 2028-2030
The bubble question resolves through one of three structural paths.
Bullish scenario · 35% probability · “Soft landing, deployment continues.” Bubble dynamics in specific categories (frontier-lab private valuations, some startup valuations, circular-financing risk in CoreWeave / Oracle / smaller AI infrastructure plays) correct 30-50 percent through 2027-2028. Mag 7 earnings continue growing, real productivity gains persist, hyperscaler capex returns are mixed but defensible. NVIDIA’s addressable share compresses gradually rather than sharply. Frontier labs (OpenAI, Anthropic) reach revenue scales that justify valuations 18-24 months later than current pricing implies. Aggregate AI investment returns positive but unevenly distributed — some big winners, some big losers, no broad-based crash.
Base scenario · 50% probability · “Telecom 2001-2003 analog with smaller magnitude.” Bubble dynamics correct more broadly through 2028. Frontier-lab valuations decline 40-60 percent from 2026 peaks. Hyperscaler capex faces material impairment cycles (covered in the capex dispatch — $50-150B aggregate). NVIDIA growth decelerates sharply (FY27-FY28 growth in 30-50 percent range vs FY26’s 75 percent). NASDAQ correction of 30-50 percent over 12-24 month period. Mag 7 free cash flow provides cushion that 1999 leaders lacked; the correction is severe but does not destroy the durable-value categories. Deployment phase continues at slightly delayed timeline; real productivity gains persist; AI infrastructure buildout continues at moderated pace through 2030.
Bearish scenario · 15% probability · “Full 2001-2003 analog.” Bubble dynamics correct broadly through 2027-2028. NASDAQ correction approaching 60-78 percent peak-to-trough (matching 2001-2003 magnitude). Multiple frontier-lab valuations collapse below VC entry pricing. Hyperscaler impairment cycles reach $300-500B aggregate. NVIDIA growth turns negative in some quarters. AI deployment timeline extends materially (2030 → 2032-2033 for genuinely-mass-deployed). Some Mag 7 names face real earnings pressure as AI revenue translation falls short of capex justification. Multi-year recovery cycle through 2028-2032.
The 35/50/15 probability allocation reflects the genuine uncertainty in resolution. The base scenario is most likely because the durable-value supports prevent the worst-case outcome but the bubble-dynamics signals are too strong to resolve without correction. The bullish scenario requires multiple uncertainties to resolve favorably simultaneously. The bearish scenario requires multiple cascading failures.
7. The strategic implications by stakeholder
The disentangled framing has direct consequences for five distinct stakeholder groups.
For public-market investors. Differentiate by category. Mag 7 names with strong free cash flow generation, defensive moats, and real AI revenue contribution (Microsoft, Alphabet, Amazon to lesser extent) have stronger fundamental support. Pure-play AI infrastructure names with high P/E and circular financing exposure (CoreWeave, certain smaller GPU cloud providers, Oracle to some extent) carry greater bubble-correction risk. NVIDIA sits in contested middle — addressable-share thesis is binary on in-house silicon migration trajectory. Position sizing should reflect category, not aggregate “AI exposure.”
For private-market investors. Mega-deal valuations (OpenAI $730B, Anthropic $380B, Databricks $134B) carry elevated correction risk through 2027-2028 if base or bearish scenarios materialize. Mid-stage AI startups with real revenue, product-market fit, and reasonable burn rates are positioned more durably than pre-revenue or thinly-revenue mega-rounds. The 1999 pattern — both winners and losers correcting sharply at peak, with winners eventually recovering — applies. Pace commitment to portfolio companies; preserve dry powder for 2028-2029 distressed opportunities if bubble correction triggers.
For founders building AI companies. Build with realistic cash runway assumptions that survive a 30-50 percent correction in 2027-2028. The peak-fundraising window of 2025-2026 may not extend to 2027. Companies that raised at “peak AI bubble” valuations may face down-rounds through 2027-2028; structure cap tables to absorb that scenario. Real revenue and product-market fit matter more than narrative; the companies that survive 2001-2003 (Amazon, Salesforce, Google when public) had real revenue or differentiated value at the time of correction.
For enterprise AI customers. Plan for AI service price volatility through 2027-2028. Prices may rise (power constraint pass-through covered in the bottleneck dispatch) or fall sharply (frontier-lab competitive pressure if base or bearish scenarios materialize). Multi-vendor sourcing reduces single-vendor exposure. Contractual flexibility (price-discount escalators, exit provisions, multi-year commitments with renegotiation triggers) preserves optionality. The deployment-phase value is real; the installation-phase pricing dynamics will fluctuate.
For policymakers. AI infrastructure has systemic significance that warrants policy attention even in the absence of clear bubble framing. Bank exposure to AI infrastructure debt ($1.5T projected by 2028) creates financial-stability considerations. Concentration in five hyperscaler companies creates antitrust considerations. Geographic relocation strategies (Microsoft UAE, Norway/Iceland) create tax-base and national-security considerations. Build policy frameworks now that can absorb both soft-landing and harder-correction scenarios through 2028-2030.
What to Do This Quarter
1. Public investors. Stop pricing “AI” as a single asset class. Differentiate Mag 7 (durable-value-leaning) from pure-play AI infrastructure (bubble-leaning) from contested middle (NVIDIA, frontier labs). Position long durable-value categories; short or underweight bubble-categories with circular-financing exposure. Use the Perez framing to size correction expectations.
2. Private investors. Pace commitment through 2026-2027. Preserve dry powder for 2028-2029. Mega-rounds at $300B+ valuations carry asymmetric correction risk. Mid-stage product-market-fit names with real revenue carry durable value through any plausible correction. The 1999 lesson: winners eventually recover; losers don’t.
3. Founders. Build with 18-24 month cash runway assumptions that survive a 30-50 percent valuation correction. Prioritize real revenue over narrative-driven funding. Structure cap tables to absorb down-round scenarios. The peak-fundraising window of 2025-2026 may not persist; raise opportunistically while it does.
4. Enterprise customers. Use multi-vendor sourcing and contractual flexibility to absorb either price-rise or price-fall scenarios. Real productivity gains from AI deployment are durable; near-term pricing volatility is structural through 2028. Negotiate accordingly.
The Strategic Read
The AI bubble question is not resolvable as a binary. The structural data shows clear bubble dynamics in five specific categories: mega-deal concentration, circular financing, hyperscaler capex velocity exceeding revenue translation, the Sequoia / Cahn argument that only AGI justifies the buildout, and capital-flow speed exceeding fundamental-realization speed. The same data shows clear durable-value characteristics in five other categories: earnings-driven rather than multiple-driven returns, Mag 7 free cash flow generation, smaller market-cap-to-profit gap than 1999, record forward margins, and real measurable productivity gains. The two faces coexist.
The contested middle resolves the question. Hyperscaler capex justification, NVIDIA addressable share, frontier-lab valuation justification — these three categories are where reasonable analysts disagree. The data through 2027-2028 will reveal which side was correct. If the bull cases on these three categories prove right, the bubble framing turns out to apply only to the obviously frothy categories. If the bear cases prove right, the bubble framing extends across the cycle’s most consequential bets.
Carlota Perez’s installation-vs-deployment framing applies. The 2024-2026 cycle is unusual in that deployment is racing alongside speculation rather than trailing it. Real productivity gains are happening now. Real revenue is being generated at scale. The structural difference from 1999 is that the underlying deployment is more advanced, which provides a floor that 1999 lacked. The base rate for installation-phase corrections in major technology cycles is meaningful — 40-50 percent at some point during the cycle’s history. The probability of full 2001-2003-magnitude correction is lower (15-25 percent).
Three scenarios are plausible. Bullish (35%): soft landing in frothy categories, deployment continues, durable-value categories sustain. Base (50%): broader correction with smaller magnitude than 2001-2003, frontier-lab valuations decline 40-60 percent, hyperscaler impairment cycles materialize but Mag 7 cushion absorbs the damage, deployment continues at delayed timeline. Bearish (15%): full 2001-2003 analog with 60-78 percent NASDAQ correction, multi-year recovery, AI deployment timeline extends materially.
The strategic implications run by stakeholder. Investors should differentiate by category rather than treating “AI” as a single asset class. Founders should build with cash runway assumptions that survive plausible corrections. Enterprise customers should use multi-vendor sourcing and contractual flexibility. Policymakers should build frameworks now that absorb both soft-landing and harder-correction scenarios.
The deeper signal: the 2024-2026 AI cycle is structurally more grounded than 1999 on price-and-fundamentals dimensions and structurally similar or worse on capital-allocation dimensions. The bifurcation explains the analyst disagreement and predicts the correction pattern: specific categories correct sharply while others persist. The disentanglement matters more than the aggregate framing because the resolution path is category-specific.
The connection to prior dispatches is the data foundation. The $725B capex dispatch provided the impairment-risk-vector framework. The power bottleneck provided the infrastructure-constraint that compounds the impairment risk. The China Sphere provided the price-compression pressure. The Anthropic IPO disclosure provided the explicit margin-compression risk factors. This dispatch synthesizes them into the bubble-vs-durable-value question that integrates the cycle.
The bubble question is not binary. Five categories show clear bubble dynamics. Five show clear durable value. Three contested categories resolve the question through 2027-2028. Carlota Perez framing applies; deployment racing alongside speculation distinguishes from 1999. Three scenarios with 35/50/15 probability allocation. Disentanglement matters more than aggregate framing.
About the Author
Thorsten Meyer is a Munich-based futurist, post-labor economist, and recipient of OpenAI’s 10 Billion Token Award. He spent two decades managing €1B+ portfolios in enterprise ICT before deciding that writing about the transition was more useful than managing quarterly slides through it. More at ThorstenMeyerAI.com.
Related Dispatches
- The $725B Hyperscaler Capex Question
- The Power Bottleneck — Grid Cliff 2027-2028
- The Anthropic IPO Disclosure Document
- The China Sphere Capability Gap Q2 Update
- Compute Concentration Audit
- Q3 SaaS Earnings Pre-Brief
Sources
- IntuitionLabs · AI Bubble vs. Dot-com Bubble: A Data-Driven Comparison · March 2026
- Janus Henderson · AI versus the Dotcom Bubble: 8 reasons the AI wave is different · October 2025
- Goldman Sachs · AI: In a Bubble (Top of Mind) · Sheridan, Rangan, Cahn, Deeter, Marcus, Briggs perspectives
- Roundhill Investments · A Case Against the AI Bubble · February 2026
- Investing.com · The Dot-AI Bubble: Why 2026 Feels Like 2000 All Over Again · October 2025
- CKGSB · AI Hype vs. Dot-Com Bubble: A 25-Year Market Lens · April 2025
- David Cahn (Sequoia) · $5T data center buildout requires AGI · October 2025
- Sam Altman · “AI bubble is ongoing” · 2025 statement
- Jamie Dimon · “some AI money will be wasted” · JPMorgan commentary
- Pierre-Olivier Gourinchas (IMF) · “surge of investment carries risk of technological bubble”
- BofA Global Fund Manager Survey · 54% AI in bubble territory · October 2025
- OECD VC data · $258.7B AI VC 2025 · 61% of total
- OpenAI $110B Series at $730B pre-money · February 2026
- Anthropic $30B raise at $380B valuation · February 2026
- Databricks $134B valuation · early 2026
- Morgan Stanley · $700B retail equity inflows since January 2026
- Carlota Perez · Technological Revolutions and Financial Capital · 2002 framework
- Rob Arnott · narrative-correct-but-mispriced-timeline analysis
- Goldman Sachs · $30-40T NASDAQ correction estimate
- McKinsey · 1.5% annual US GDP boost from AI by 2030 projection