This is not financial advice. Nothing in this article should be used to inform real trading decisions. The bot described here trades exclusively with simulated money. If you build something similar and run it with real funds, you should fully expect to lose them — that is the most likely outcome, by a wide margin, regardless of what early numbers suggest.
What I’m doing, in one paragraph
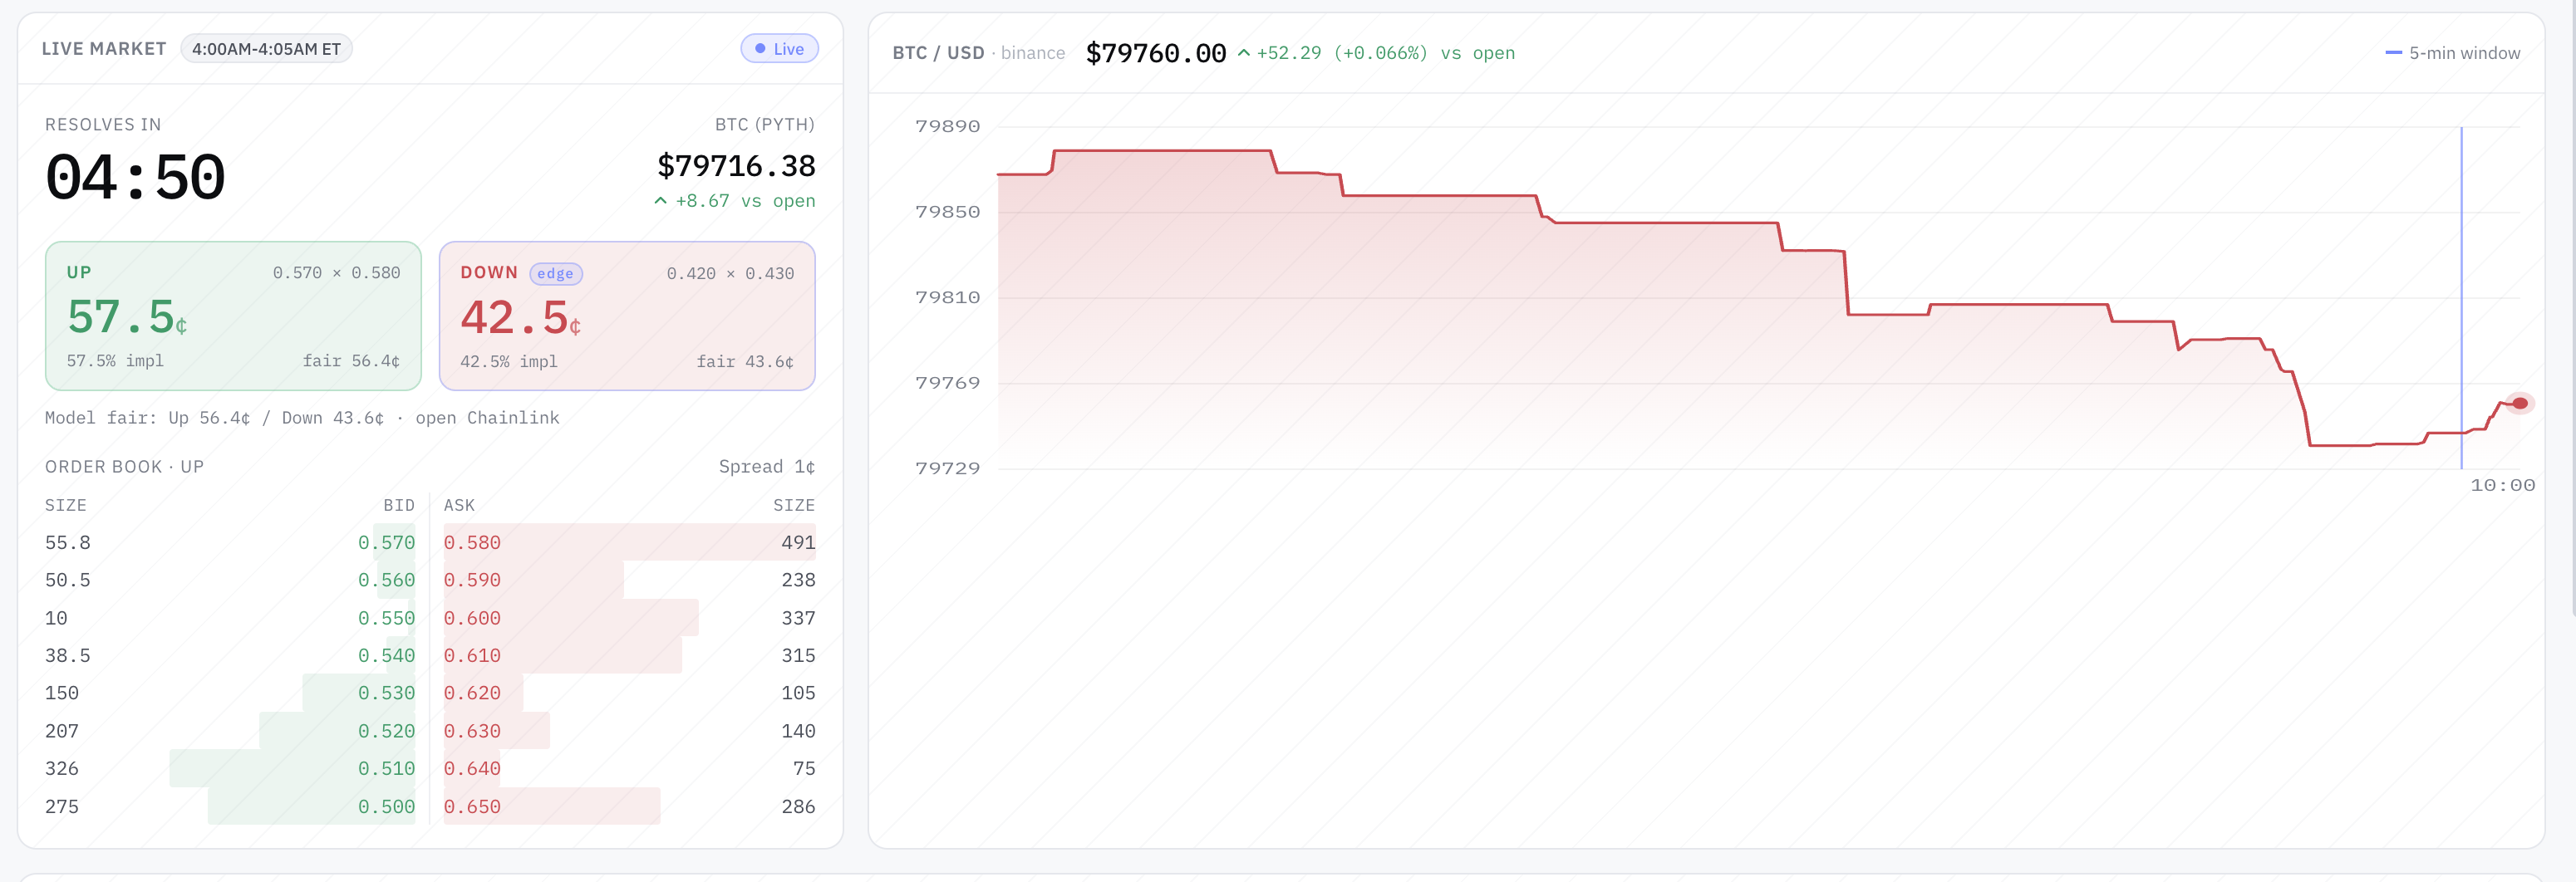
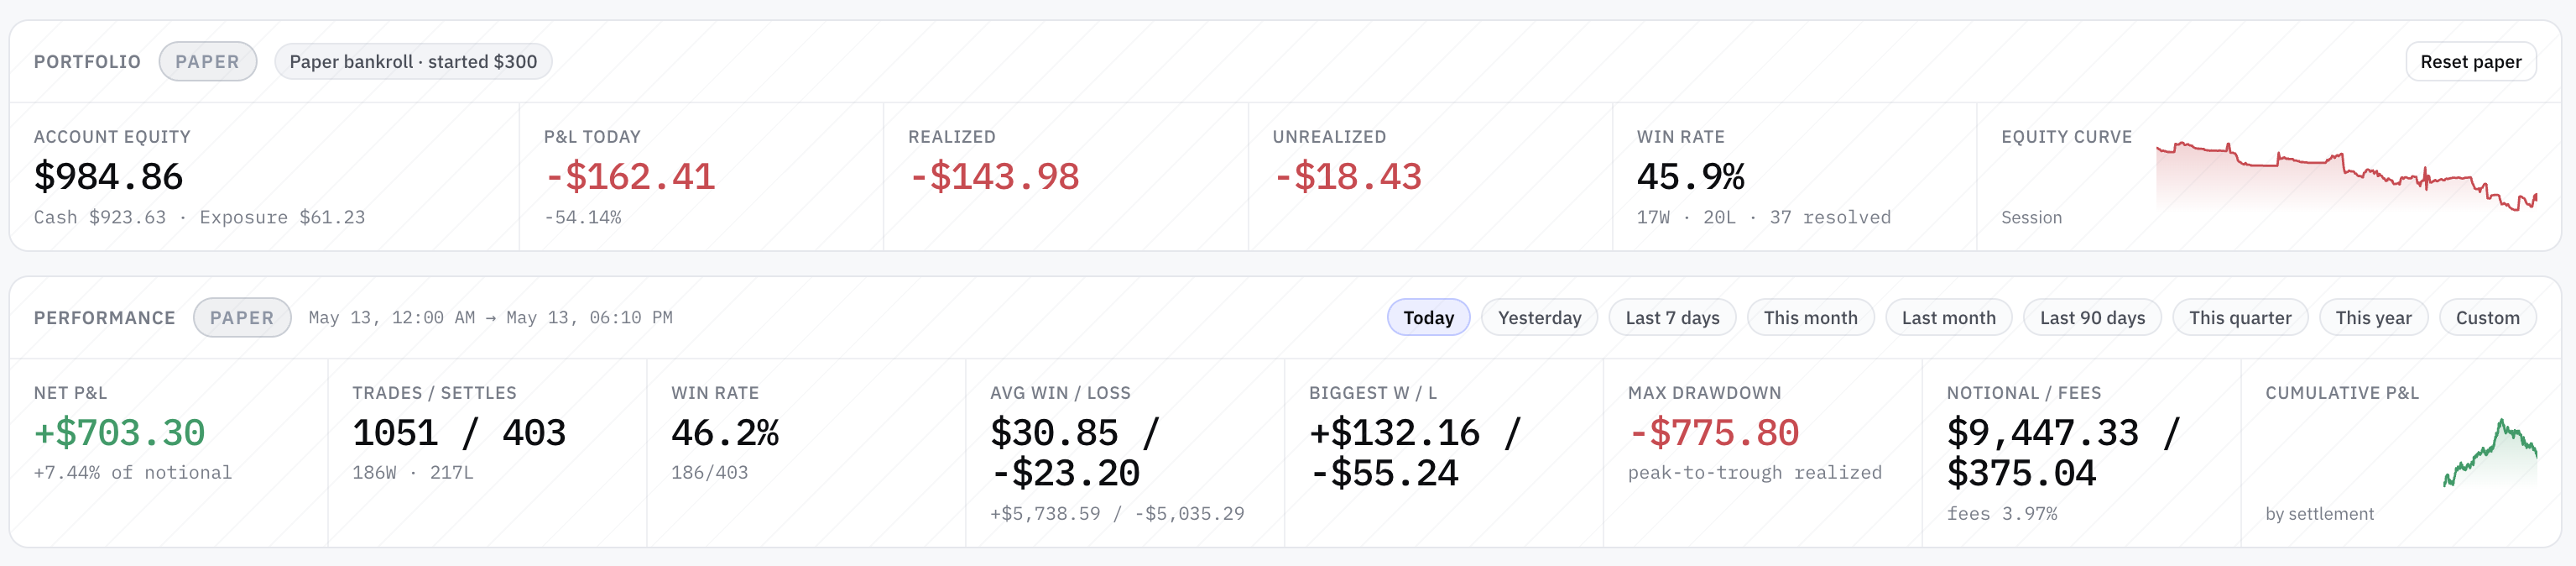
I’ve been running an experimental AI-driven trading bot against a set of very short-dated binary prediction markets — specifically the 5-minute “Up or Down” markets for major crypto assets. The bot runs 21 strategy variants in parallel, each on its own simulated bankroll, each using a different combination of approach (four strategy families) and underlying (four assets). Every trade is paper — no real funds are on the line — but the market data, order books, fees, and latency model are all real. It’s a research lab, not a wallet.
The point isn’t to make money. The point is to find out whether any of the strategies could make money if it were ever turned loose with real funds, while being able to delete the entire experiment without consequence if the answer is no.
After several days and over 700 settled trades across the fleet, here is what the data is telling me — and more importantly, what it is not telling me, despite what it looks like at first glance.
Week one.
Why a 90% win rate
can still lose money.
21 strategies running in parallel · 700+ settled paper trades · 18 of 21 with reasonable win rates · 2 variants at 100% wins. And almost none of it means what it looks like.
An experimental AI-driven trading bot running 21 strategy variants against 5-minute binary prediction markets on major crypto assets. Every trade is paper — simulated funds only. Headline numbers look extraordinary: 18 of 21 variants with reasonable win rates · entire fleet on one underlying with >90% wins · two specific variants at 100% wins over 38-44 settled trades. The data is telling a very different story than the leaderboard suggests. Most of the "winning" strategies are buying when the market has already priced one side at 90-95 cents on the dollar — the right baseline isn't 50%, it's the market-implied probability, and below 95% wins on that math is a slow bleed. One strategy — and only one — has the opposite signature: below-50% win rate, 2.5× average winning trade vs losing trade, meaningfully positive net P&L over several hundred settled positions. The right signature. The smoking-gun negative result: same code running on different assets is statistically significantly losing money. Same model, same parameters, different markets, different results — that's data you'd pay for.

Algorithmic Trading as a Simulator: Learning Backtesting, Market Rules, Risk, and Automated Trading Through Synthetic Data
As an affiliate, we earn on qualifying purchases.
As an affiliate, we earn on qualifying purchases.
90% wins. Still net negative.
Most of the "winning" strategies in the fleet are buying when the market has already decided one side is going to win. They wait until one outcome is priced around 90-95 cents on the dollar, then take the favorite. If the favorite holds, the trade pays a few cents. If it doesn't, the trade loses almost the entire bet. The asymmetry makes the high win rate structurally meaningless.

AI Crypto Trading Bot: Build AI-Powered Crypto Trading Systems With Binance, Bybit & 24/7 Automation (AI Trading Systems Series Book 2)
As an affiliate, we earn on qualifying purchases.
As an affiliate, we earn on qualifying purchases.
One candidate. Right signature.
After dismissing the high-win-rate experiments as mechanical illusions, the search shifted to the opposite signature — a strategy that loses more often than it wins but still makes money. That's the mathematical fingerprint of a real prediction signal: bigger wins than losses, willing to be wrong frequently in service of being right with conviction.

Spectral Finance: Signal Processing, Fourier Analysis & Quantum Tools for Market Prediction
As an affiliate, we earn on qualifying purchases.
As an affiliate, we earn on qualifying purchases.
Same code. Different markets.
The strongest evidence that the candidate strategy might be real comes from an unexpected place: running the exact same code on different assets produces statistically significant losses. Same model, same parameters, same code path, different volatility regime, different microstructure, different result.

Use Claude to Build 7 AI Trading Bots : Stocks, Options, Crypto. The Multi-Strategy Playbook used for Backtesting and Live Trading (AI Trading Bot Series 2)
As an affiliate, we earn on qualifying purchases.
As an affiliate, we earn on qualifying purchases.
Five lessons. Plain language.
What week one actually taught. The lessons are not novel to anyone who has spent serious time on systematic trading — but you don't internalize them until you watch them happen on your own paper bankroll. Out of 21 variants, one candidate worth more investigation. The ratio is roughly what was expected going in.
Win rate lies. Sample sizes lie. Most things that look like alpha are not. A high win rate, by itself, tells you almost nothing about whether a strategy has edge — it tells you about the kind of trades being taken, not the quality of the decisions. One strategy in the fleet has the right signature — <50% wins, 2.5× win:loss, meaningfully positive net P&L on the most liquid underlying. That's the candidate worth watching. Same code on different markets produces statistically significant losses — informative in a way "everything's green" never is. If you take this article as a reason to put money into anything, you have misread it.
The headline number is a trap
If you only looked at the leaderboard, you'd see:
- 18 out of 21 strategies showing reasonable win rates
- An entire fleet of variants on one underlying with >90 % win rates
- Two specific variants sitting at 100 % wins over 38–44 settled trades
That sounds extraordinary. It is not. It is one of the most common traps in evaluating any trading or prediction system, and I walked right into it before catching myself.
Here's why.
The right baseline isn't 50 %
Most of these "winning" strategies are buying when the market has already decided one side is going to win. They wait until late in a window, when one outcome is priced around 90–95 cents on the dollar, and then they take the favorite. If the favorite holds, the trade pays a few cents. If it doesn't, the trade loses almost the entire bet.
So the relevant question is not "do you win more than half the time?" — coin-flip is irrelevant. The relevant question is: do you win at the rate the market is already pricing in?
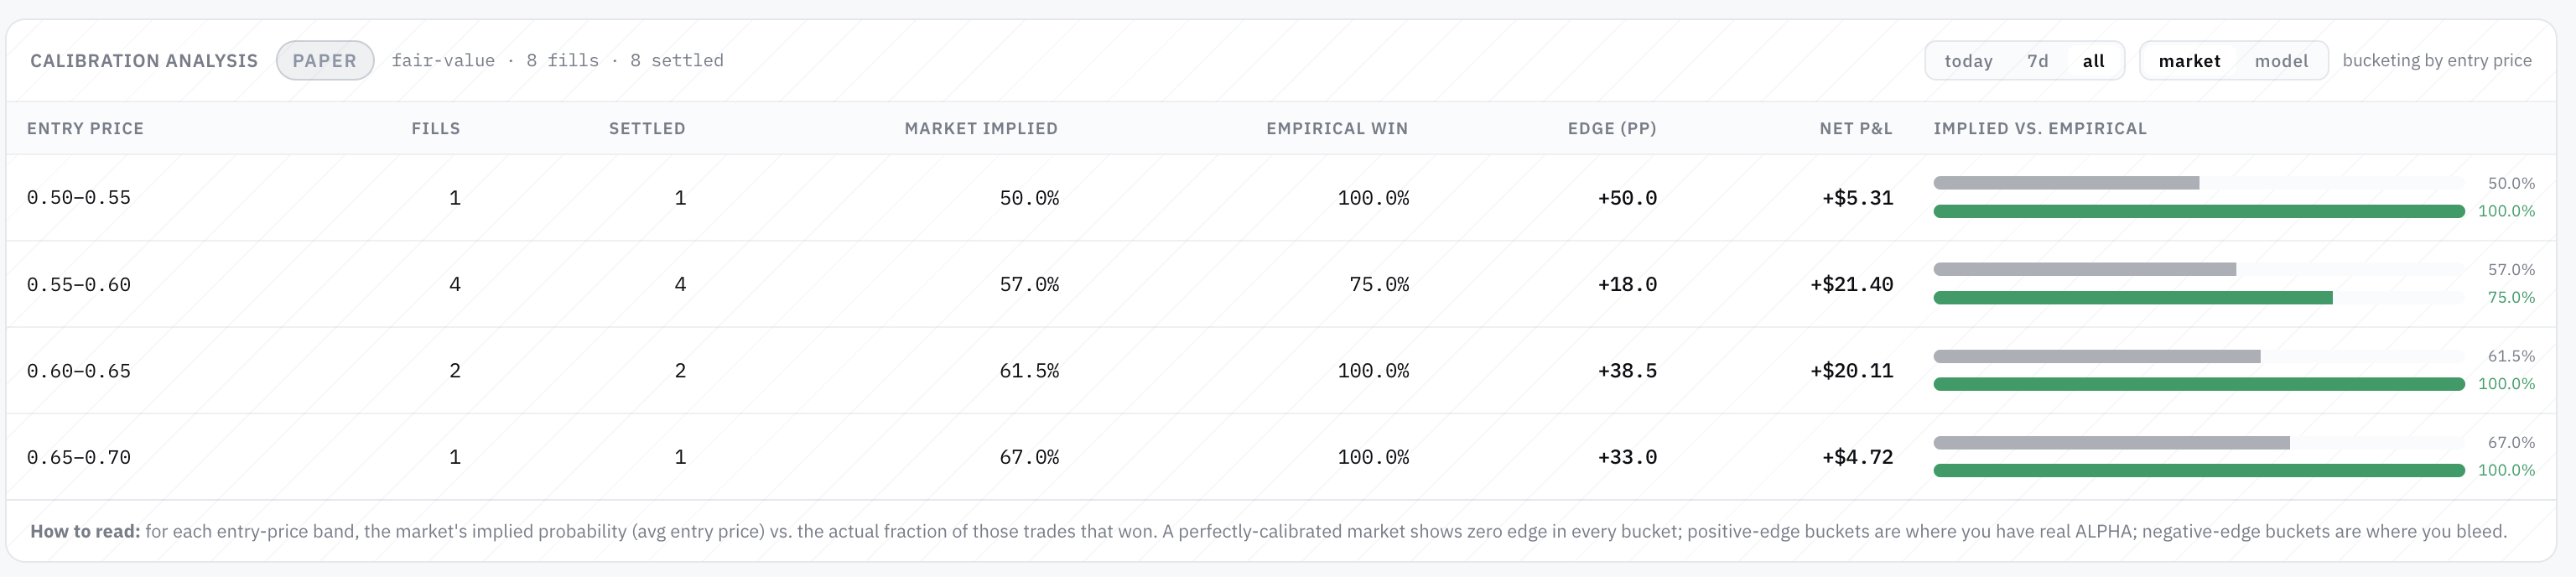
If the market is pricing the favorite at 95 % to win, you need to win at least 95 % of those trades just to break even after the asymmetric payoff. Anything less than 95 % is a slow bleed, regardless of how confident the percentages look.

Once I re-ran the numbers against the correct baseline — the market-implied probability rather than the naive 50 % — the picture changed completely:
| Strategy family | Naive read | Honest read |
|---|---|---|
| "High win rate" variants on one asset | "98 % wins! Edge!" | Below the market's own implied 95 % rate — slightly negative edge |
| "100 % win rate" variants over ~40 trades | "Perfect! Alpha!" | Statistically indistinguishable from a 95 % true rate getting lucky on a small streak |
| Aggregate of 16 sniper-style variants | "Hundreds of winning trades" | Net negative P&L despite 90 % wins, because the 10 % of losses are 19× the size of the wins |
If you take only one thing from this article, it should be that a high win rate, by itself, tells you almost nothing about whether a strategy has edge. It tells you about the kind of trades being taken, not the quality of the decisions.
The one strategy that might actually have an edge
After dismissing the high-win-rate experiments as mechanical illusions, I went looking for the opposite signature — a strategy that loses more often than it wins but still makes money. That's the mathematical fingerprint of a real prediction signal: bigger wins than losses, willing to be wrong frequently in service of being right with conviction.
One strategy in the fleet — and currently only one — looks like that.
It runs on the most liquid underlying. It's a fair-value style model rather than a momentum / favorite-rider style. Its win rate is below 50 %, but its average winning trade is roughly 2.5× its average losing trade. The net result over several hundred settled positions has been meaningfully positive.
That's the right signature. That's what you actually want to see if you're looking for edge.
But — and this is a huge but — the sample is still too small to call. A few hundred settles is enough to reject "obviously useless"; it is nowhere near enough to confidently claim "this is real edge that will persist." A favorable variance window of the right length can produce numbers that look exactly like this without any underlying skill at all.
I'll be running this variant for at least an order of magnitude more trades before I'm willing to say more than "this is the candidate worth watching."
I'm not going to share the specifics of how the model is built, what features it uses, or where the parameters land. Some of that is research-stage and not ready; some of it is the only piece of this experiment that might have any genuine signal in it, and broadcasting the recipe would make whatever edge exists evaporate the moment anyone copied it. Future articles will share what the findings show — they won't share the cookbook.
The smoking-gun negative result
The strongest evidence that the candidate strategy might be real comes from an unexpected place: running the exact same code on different assets.
The same fair-value strategy that's positive on one underlying is statistically significantly losing money on others — to the point of one variant being a 99 %-confidence negative-edge strategy. Same model. Same parameters. Same code path. Different volatility regime, different microstructure, different result.
Why does this matter? Because a strategy that works equally well on everything is almost always a fluke. A strategy that works on one specific market structure and fails on others is doing something — it's just possibly the wrong something, or the right something for the wrong reasons. Either way, the result is informative in a way that "everything's green" never is.
It also gave the experiment a useful kill criterion: as the cross-asset variants ran themselves down toward zero, they generated clean evidence that the underlying model is not universal. That's data I would have paid for. Instead, I got it from a $300 simulated bankroll evaporating in an interesting way.
What week one actually taught me
A short list, in plain language:
- Win rate is the wrong metric. P&L distribution and expected value are everything. A 95 %-win strategy that loses 19× as much when it's wrong is a worse trade than a 45 %-win strategy that pays 2× as much when it's right.
- The right null hypothesis is not "random." It's "whatever the market is already pricing." If your strategy isn't beating that, you don't have an edge — you have a confusing way to copy the consensus.
- Run the same strategy on multiple markets before believing it works. If it falls apart when you change the underlying, it might be real and narrowly applicable. If it works on everything, it's almost certainly variance.
- Disable risk gates only as a teaching exercise. Several experiments hit their drawdown limits, I loosened the gates, they tripped again, I disabled the gates entirely, and they ran themselves to zero. That run-to-zero was extremely informative. Doing the same thing with real money would have been a disaster.
- Most strategies will be flat-to-losing. Out of 21 variants, I currently see one candidate worth more investigation. The rest are either mechanical illusions, statistically-confirmed losers, or are too noisy to tell apart from random. That ratio is roughly what I expected going in — but you don't internalize it until you watch it happen.
What's next
This is week one. There are several follow-up articles planned in this series as the experiment continues:
- Week two: longer-horizon results on the one candidate strategy, and whether the early signal survives more data
- A piece on the "100 % win rate" trap in more depth — useful for anyone evaluating any system that claims a high success rate on small samples
- Cross-asset and cross-regime analysis as more underlyings and more market conditions get sampled
- What replay testing tells us — running recorded market data back through the strategies offline, deterministically, to separate edge from variance
I'll keep the trade-secret stuff out of every one of these. The goal isn't to teach you how to clone the bot; the goal is to share what the experiment says, honestly, including when it says "you don't actually know yet."
Final disclaimer
To be very explicit:
- I am not a licensed financial advisor.
- Nothing in this article is investment advice, trading advice, or a recommendation to do anything.
- The bot described here trades with simulated money in a research environment. No real funds are at risk.
- If you build a similar system and use it with real funds, you should expect to lose those funds. Prediction markets in general — and 5-minute binary markets in particular — are zero-sum after fees, dominated by sophisticated participants, and structurally hostile to part-time retail strategies.
- Early-stage paper-trading results, including the ones above, are not predictive of real-money outcomes. Real markets behave differently when your orders are part of the book. Slippage, fill failures, network latency, and adverse selection are all worse in practice than in simulation.
- The "candidate strategy" identified above is not something I am running with real money, and I do not plan to.
If you take this article as a reason to put money into anything, you have misread it. The honest takeaway is much smaller: win rate lies, sample sizes lie, and most things that look like alpha are not. That's the lesson. Everything else is a placeholder.
— Thorsten Meyer AI · Part 1 of an ongoing series. Subscribe / follow for further updates as the data accumulates.