
By Thorsten Meyer — May 2026
The Stanford AI Index 2026 landed three weeks ago. Four hundred plus pages, ninth edition, eleven chapters spanning research, technical performance, economy, responsible AI, science, medicine, education, policy, public opinion. The Index is the single most-cited annual document on artificial intelligence. Major newspapers cite it. Governments reference it. Hundreds of academic papers anchor their AI claims to its numbers. The 2026 edition will shape how policymakers, executives, and journalists frame the AI conversation through the rest of the year.
This dispatch is an audit of the Index itself. Where the methodology is rigorous, where it is structurally limited, where the data is most and least reliable, and how to read the document with the appropriate level of skepticism. The Index acknowledges several of its own limits — the steering committee is intellectually honest about benchmark saturation and the “jagged frontier” framing. The audit goes further: there are categories of methodological constraint the Index does not explicitly call out, and readers who treat the document as the unmediated state of AI rather than as a curated and necessarily-partial snapshot will draw conclusions that the underlying data does not support.
The point is not to attack the Index. Stanford HAI’s program is genuinely valuable, and a less rigorous alternative would be much worse. The point is that a 400-page document distilled from disparate sources, written for a policy and executive audience, produced by a steering committee that includes both academic and industry members, in a field where the most capable models disclose the least, cannot be read uncritically. The Index’s authority creates the obligation to audit it.
The dispatch on the FDE economics 2.0 update showed how compensation data can be precise. The dispatch on the compute concentration audit showed how cloud market share can be triangulated from multiple sources. This piece audits a document that aggregates both kinds of data plus survey research, public sentiment, scientific publication metrics, and benchmark performance, and identifies where the aggregation introduces error that the citation chain then propagates.
Reading the report card with a critic’s pen.
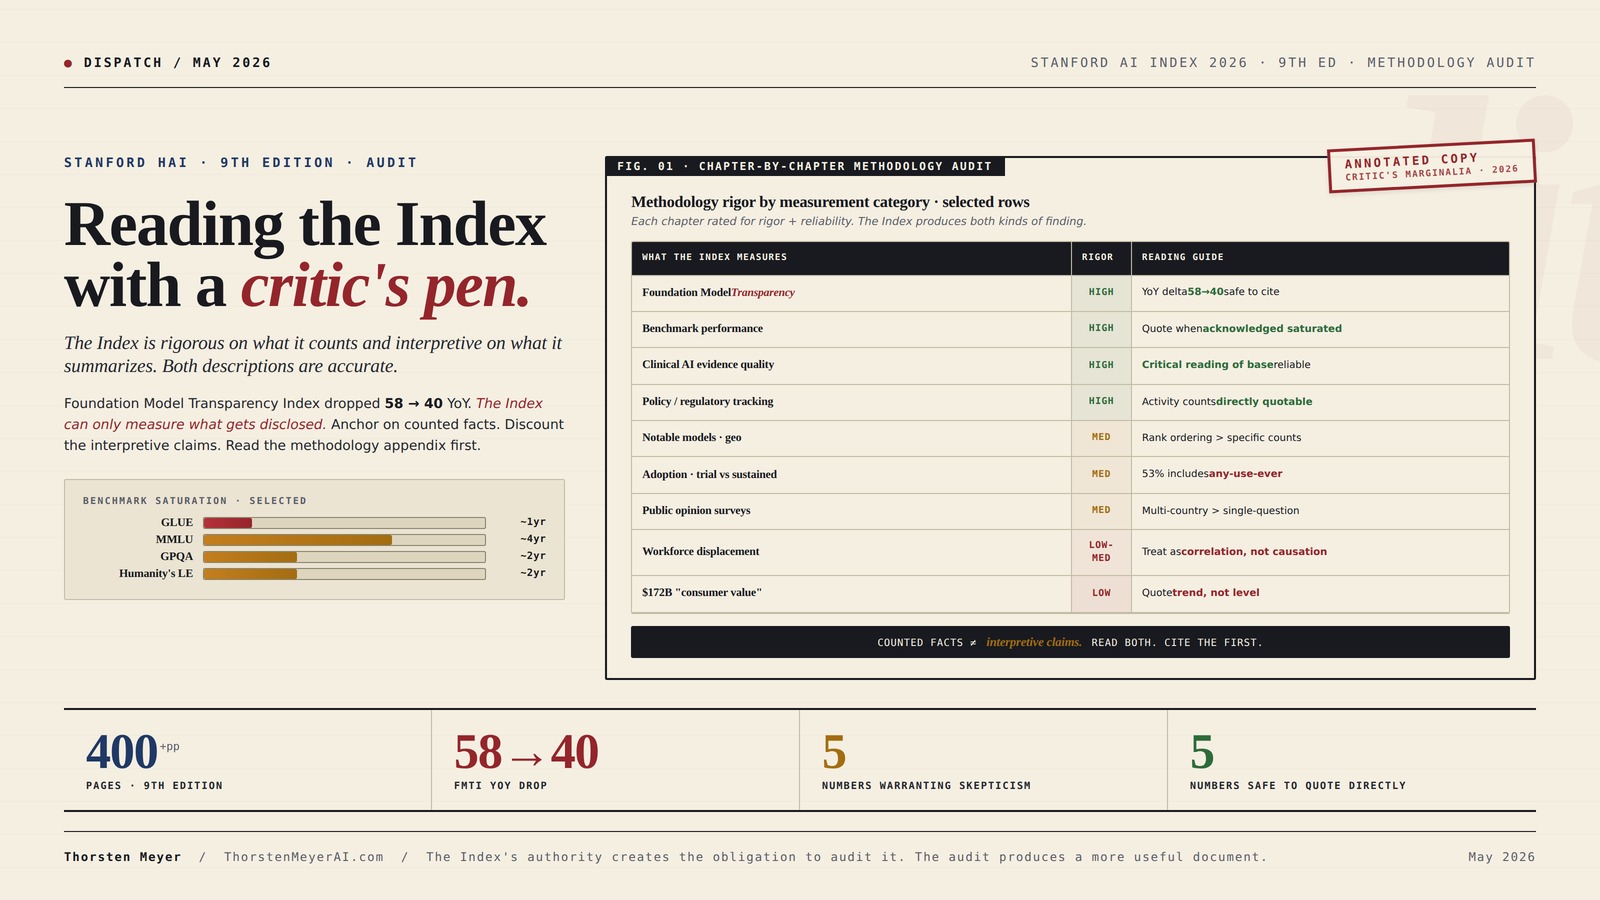
The Index is rigorous on what it counts and interpretive on what it summarizes. Both descriptions are accurate.
The Stanford AI Index 2026 is the most cited annual document on AI. 400+ pages, 9th edition, 11 chapters. The Foundation Model Transparency Index dropped 58 → 40 in one year. The Index can only measure what gets disclosed. The audit identifies where to anchor on counted facts, where to discount the interpretive claims, and how to read the document with appropriate skepticism.
Where the Index is rigorous. Where the Index is interpretive.
The Index is most rigorous on what it counts (publications, models, dollars, policies, benchmark scores). It is least rigorous on what it interprets (consumer value, workforce impact, public sentiment). Anchor on counted facts. Treat interpretive claims with proportionate skepticism.

Qualitative Data Analysis With Chatgpt And Qualcoder: A Step-By-Step Guide To AI-Powered Coding And Thematic Analysis (AI-Powered Research Toolkit — A Mastering Research Series)
As an affiliate, we earn on qualifying purchases.
As an affiliate, we earn on qualifying purchases.
Benchmarks saturate faster than they’re constructed.
The Index reports benchmarks at the moment of saturation — by which time the benchmark has lost most of its discriminating power. The benchmarks the 2026 Index reports are running out of useful signal even as they are being published. The 2027 Index will need new benchmarks the 2026 frontier doesn’t saturate.

Deep Medicine: How Artificial Intelligence Can Make Healthcare Human Again
Book: deep medicine: how artificial intelligence can make healthcare human again
As an affiliate, we earn on qualifying purchases.
As an affiliate, we earn on qualifying purchases.
Five reliable. Five fragile.
Specific numbers from the 2026 Index that should be quoted directly versus quoted only with explicit confidence intervals. The same Index produces both kinds of finding. Distinguishing them is the audit’s central practical contribution.
- FMTI 58→40 YoYIndex’s own measurement of explicit construct. Documented methodology. Trend unambiguous.
- Arena Elo top tierAnthropic 1503, xAI 1495, Google 1494, OpenAI 1481. Standardized methodology. Quote directly.
- Closed-vs-open gap 3.3%Up from 0.5% in Aug 2024. Precise measurement of structural shift. Open-vs-closed inflection.
- Robots 12% household tasksMost underappreciated number in entire Index. Concrete physical-world gap.
- Apollo Go 11M rides +175% YoYPublic-record disclosure. Clean methodology. Chinese AV scale underreported.
- $172B “consumer value”Willingness-to-pay survey data. Real CI: ~$50–300B. Quote trend, not level.
- 53% global adoption in 3 yearsIncludes any-use-ever. Sustained use ~20–30%. Clarify the definition.
- Median value tripled ’25-’26Same WTP methodology. Probably 1.5–4×. Direction reliable, magnitude not.
- US ranks 24th at 28.3%Trial-vs-sustained sensitivity. Rank > absolute %.
- “Hits young workers first”Multiple alternative explanations. Treat as correlation, not causation.
The Index’s authority creates the obligation to audit it. The audit produces a more useful document, not a less useful one.

ESSENTIAL AI TOOLS FOR TRANSPARENT MODELS USING SHAP, LIME, AND VISUALIZATION TECHNIQUES: 65 PRACTICAL EXERCISES TO ENHANCE INTERPRETABILITY AND TRUST IN BLACK-BOX MODELS
As an affiliate, we earn on qualifying purchases.
As an affiliate, we earn on qualifying purchases.
Four assignments. By role.
Read the methodology appendix first.
Even if you cited prior editions, the 2026 has more rigor on some numbers and more interpretive freedom on others. Quote rigorous numbers directly. Caveat interpretive numbers. Acknowledge the Index’s own self-criticism in your citation. Stanford HAI’s authority comes partly from its self-criticism — preserving that in citation chains preserves the authority.
Use the FMTI drop as institutional pressure.
The 58 → 40 transparency drop is the field’s primary authoritative scoreboard saying you disclose less than you used to. Visibility in the Index — and the framing capture that comes with it — depends on willingness to disclose. Labs that publish more methodology capture more positive framing. Labs that publish less become invisible to the document that policymakers read.
Calibrate use to category gradations.
Policy chapter is most rigorous and most directly actionable. Public-opinion chapter most subject to framing effects. FMTI is the single most important methodological signal. Do not quote consumer-value dollar figure as a fact; quote the trend instead. Read policy + transparency carefully. Read public-opinion with skepticism.
Use the Index as starting point, not citation chain endpoint.
Read the methodology appendix before any chapter. The science and medicine chapter framings are unusually critical and worth integrating into your own work. Treat “notable models” geographic distribution as curated rather than complete picture. Underlying source surveys and labor-market studies are the real citation chain.

AI Systems Performance Engineering: Optimizing Model Training and Inference Workloads with GPUs, CUDA, and PyTorch
As an affiliate, we earn on qualifying purchases.
As an affiliate, we earn on qualifying purchases.
Executive Summary · The Audit in One Table
| What the Index measures | Methodology rigor | Most reliable | Least reliable |
|---|---|---|---|
| Benchmark performance | High | When acknowledged saturated | Cross-time comparisons |
| Foundation Model Transparency | High | Year-over-year delta | Absolute scores |
| Notable models geographic distribution | Medium | US-China rank ordering | Specific counts |
| Investment / private capital | Medium-high | Aggregate flows | Per-company allocation |
| Adoption metrics | Medium | Cross-country comparisons | Sustained-use vs trial |
| $172B “value to consumers” | Low | Trend direction | Absolute dollar amount |
| Scientific publication counts | High | Volume trends | AI-share calculation |
| Clinical AI evidence quality | High | Critical reading of base | Effectiveness claims |
| Workforce displacement data | Low-medium | Directional | Causation attribution |
| Public opinion surveys | Medium | Multi-country comparisons | Single-question tests |
| Policy / regulatory tracking | High | Activity counts | Effectiveness assessment |
The pattern: the Index is most rigorous on what it counts (publications, models, dollars, policies, benchmark scores). It is least rigorous on what it interprets (consumer value, workforce impact, public sentiment). Readers should anchor on counted facts, treat interpretive claims with proportionate skepticism, and read the methodology appendix in the back of the document — which the Index makes accessible — before quoting any single number.
1. What the Index does well · the rigor side
I want to lead with what the Index gets right, because the criticisms only make sense against the baseline of genuine intellectual seriousness.
Strength 1 · Benchmark performance tracking is rigorous. The Index aggregates results from approximately 30 standardized benchmarks across language, vision, reasoning, scientific tasks, robotics, and agentic capabilities. The Humanity’s Last Exam progression (8.8% in 2025 → 38.3% later → 50%+ for Claude Opus 4.6 and Gemini 3.1 Pro by April 2026) is documented from public sources with appropriate timestamps. The GPQA results (93% vs human baseline 81.2%) and the OSWorld trajectory (12% to 66.3%) are similarly well-sourced. When the Index reports a benchmark number, the citation chain is traceable.
Strength 2 · The Foundation Model Transparency Index is structurally honest. The 58→40 score drop year-over-year (lowest year-over-year change of any tracked metric in 2026) is the Index pushing back against industry opacity. The fact that the Index publishes a transparency assessment that gives top labs poor scores is evidence that the document is not captured by industry. Other 400-page reports written to the same audience would be less direct.
Strength 3 · The acknowledgment of jagged frontier limitations is unusual. Most AI summary documents either claim universal capability advances or universal capability limits. The Index’s framing — that AI is achieving graduate-level math reasoning while failing at common-sense clock-reading — is methodologically honest. The Perrault quote (“knowing that a benchmark for legal reasoning has 75 percent accuracy tells us little about how well it would fit in a law practice’s activities”) is the kind of self-qualification that rarely appears in industry-aligned AI reporting.
Strength 4 · Cross-jurisdictional policy tracking is comprehensive. The policy chapter aggregates data across the US, EU, UK, China, Korea, Japan, India, Brazil, UAE, Singapore, and 30+ other jurisdictions. Activity counts (laws passed, regulatory bodies created, public investment dollars committed) are anchored to public-record sources. This is genuinely hard work, and the Index does it at a level of completeness that no government or industry source matches.
Strength 5 · The new science and medicine chapters elevate the document. The 2026 addition of dedicated science and medicine chapters reflects where AI is actually generating value. The medicine chapter’s critical assessment (“nearly half of more than 500 clinical AI studies relied on exam-style questions rather than real patient data, and only 5% used real clinical data”) is a serious methodological challenge to the field, not vendor cheerleading.
The Index, taken on its own terms, is the most rigorous synthesizing document on AI that exists. The methodology audit that follows operates within that frame, not against it.
2. Where the methodology is structurally limited
Five categories of limitation that affect how the Index’s numbers should be interpreted.
Limitation 1 · The Index can only measure what gets disclosed. This is the Foundation Model Transparency Index’s core insight applied to the Index as a whole. Industry-released models dominate the field — 50 “notable” models from US organizations in 2025 per Epoch AI’s count, with China closing the gap. But industry is increasingly closed. Training compute, dataset composition, parameter counts, evaluation methodology — much of this is no longer published. The transparency index dropped from 58 to 40 in one year. By construction, the AI Index can track only the publicly-disclosed portion of frontier AI development. The unpublished portion — which is increasing as a share of total — is invisible. Readers should treat the Index’s frontier-capability picture as a lower bound rather than as a complete description.
Limitation 2 · Benchmark saturation compresses the window of usefulness. The Index itself notes that “evaluations intended to be challenging for years are saturated in months.” Humanity’s Last Exam was constructed in 2024 to be hard for AI. By 2026, top models exceed 50%. GPQA was hard for humans in 2023; by 2025 frontier models exceed the human baseline by 12 percentage points. This is the structural problem with benchmark-anchored progress measurement: the Index reports benchmarks at the moment of saturation, by which time the benchmark has already lost most of its discriminating power. A reader who anchors progress on 2025-saturated benchmarks misses the next year’s capability frontier almost by definition.
Limitation 3 · “Notable models” depends on the curation. The Index uses Epoch AI’s count of “notable models” to track geographic distribution. Epoch AI is a serious research organization and its curation methodology is documented. But the “notable” criterion is itself a choice — different criteria would produce different counts, different geographic distributions, and different competitive dynamics. The reported 50-model US lead and the China-closing-gap framing both depend on Epoch’s curation choices. A different curation methodology would tell a different story without falsifying any underlying fact.
Limitation 4 · Survey-derived numbers are fragile. The “$172B annual value to U.S. consumers” figure derives from willingness-to-pay surveys. Behavioral economics research is consistent and clear: stated willingness-to-pay surveys produce numbers that are weakly correlated with actual market behavior and are heavily sensitive to question framing. A 2x error band on the $172B figure is plausible. The trend direction (median value tripled between 2025 and 2026) is more reliable than the absolute number, because the methodology is consistent across periods. Readers who quote “$172 billion” as a headline should anchor on the trend, not the level.
Limitation 5 · Adoption metrics conflate experimentation with sustained use. The “53% generative AI population adoption in three years” claim is striking but covers a wide range of behavioral patterns. A user who tried ChatGPT once is counted alongside a user who pays $20/month and uses it daily. The Index’s underlying data does not disaggregate trial from sustained use. The U.S. ranking 24th globally at 28.3% is similarly affected — a country with high trial-adoption but low sustained-use looks the same as a country with the opposite pattern. This is not a flaw the Index introduced; it reflects what the source surveys measure. But the headline number propagates through citations as if it were a sustained-use number.
3. Where the framing has structural bias
The Index’s framing choices are genuine choices, made by a steering committee with views. Three places where the framing produces results that a different committee with the same data might not produce.
Frame 1 · Optimism bias in the public-opinion presentation. The 2026 Index reports that 59% of global respondents feel “optimistic about the benefits” of AI, up from 52%. The same dataset reports 52% feel “nervous” about AI, up 2%. The Index leads with the optimism number. The framing choice is defensible — global aggregate optimism rose more than nervousness. But a different framing would emphasize that more than half the global population reports nervousness, that the gap between optimism and nervousness narrowed (from 8 points to 7 points), and that the absolute level of nervousness is at its highest point in the time series. The same data supports very different headlines.
Frame 2 · The “jagged frontier” frame absorbs criticism that other frames would surface. Stanford HAI’s chosen meta-frame — that AI gets very smart in some domains while remaining deficient in others — is genuine and useful. But it is also a frame that prevents alternative critical frames from getting equal treatment. “Capability overhang” (the gap between what a model can do and what it is being deployed for), “evaluation gaming” (the extent to which benchmark optimization produces capabilities that don’t generalize), and “deployment lag” (the gap between capability advance and economic deployment) are all alternative ways of organizing the same data. None of them gets the central treatment that “jagged frontier” gets in the Index. Readers who internalize jagged-frontier as the meta-frame inherit Stanford’s specific lens.
Frame 3 · Environmental cost is visible but compressed. The 2026 Index mentions environmental cost more than prior editions. The mention is appropriate. But the depth of treatment is short relative to the depth on, say, clinical AI medical applications or scientific AI publication counts. A reader could finish the Index believing environmental cost is one factor among many rather than understanding it as a constraint that shapes whether AI’s economic value translates to net societal value. Other documents (the compute concentration audit dispatch earlier in this series, the IEA’s energy-and-AI projections, McKinsey’s data center capacity reports) treat environmental cost as a binding constraint. The Index does not.
4. Where the Index is genuinely vendor-influenced
Vendor influence on the Index is real but is mostly subtle. The steering committee includes industry experts; this is necessary because the field is industry-dominated and academic-only oversight would miss important developments. The question is whether the influence produces specific framings that an industry-free committee would not produce.
Influence pattern 1 · Benchmark selection. Most of the benchmarks tracked in the Index were created by or with the participation of companies that have models being evaluated on those benchmarks. This is not corruption; it is the structure of the field. But the benchmarks selected for the Index favor capabilities that are easier to measure cleanly. Capabilities that are harder to measure (long-horizon reliability, real-world deployment success, cost-per-task in production environments) get less treatment because there are fewer standardized benchmarks for them. The bias is toward the measurable rather than the important.
Influence pattern 2 · “Calibrate our data with external organizations.” The Index’s methodology section notes that “we worked with a broader set of external organizations to calibrate our data.” External organizations include AI labs, AI evaluation firms, AI investment platforms, and AI policy think tanks. Each has views and incentives. Calibration is necessary; the question is whether the calibration process tilts findings in specific directions. The 58→40 transparency score drop suggests the calibration is not capturing the labs’ preferred framings, which is reassuring. Other findings — the framing of “notable models,” the willingness-to-pay calculation, the economic-impact estimates — are less obviously vendor-skeptical.
Influence pattern 3 · The Index’s audience is policymakers and executives. The document is necessarily written for an audience that prefers headline numbers, clean trend lines, and confident framings. The Index’s writers are aware of this and qualify their claims appropriately, but the format itself favors confident statement over methodological hedging. A version of the Index written for academic peer review would have substantially more uncertainty quantification, alternative-explanation discussion, and methodological appendices. The current format necessarily compresses these.
The vendor influence on the Index is real and structural, but it is much more subtle than the influence in industry-funded reports. Readers should not dismiss the Index because of vendor influence — they should adjust their reading to account for the directions in which the influence pulls.
5. The benchmark saturation problem · why this matters most
This is the single most important methodological constraint, and it is going to get worse through 2026-2028.
The Index’s progress narrative depends on benchmark performance over time. When a benchmark goes from 8.8% to 50%+ in 18 months, the narrative is “rapid progress.” When the same benchmark plateaus near 100% the following year, the narrative becomes “saturation, time for a new benchmark.” When the new benchmark is constructed to be hard for the current generation of models and the next-generation models saturate it within months, the cycle repeats.
The compression is observable. Five benchmarks tracked across recent Index editions:
| Benchmark | Year created | Year of saturation | Time to saturation |
|---|---|---|---|
| GLUE | 2018 | 2019 | ~1 year |
| SuperGLUE | 2019 | 2021 | ~2 years |
| MMLU | 2020 | 2024 | ~4 years |
| GPQA | 2023 | 2025 | ~2 years |
| Humanity’s Last Exam | 2024 | ~2026 | ~2 years |
| OSWorld | 2024 | ~2027 (projected) | ~3 years |
The trend line: each new benchmark saturates faster than the previous one, in absolute terms. The implication for the Index’s progress narrative: the benchmarks the 2026 Index reports are running out of useful discriminating power even as they are being published. The 2027 edition will have to introduce new benchmarks that the 2026 frontier models do not saturate, and those new benchmarks will themselves be saturated before the 2028 edition.
This produces a structural bias in the progress narrative. The Index reports progress at the rate of benchmark introduction, which is slower than the rate of underlying capability advance. Readers who anchor their progress estimates on the Index’s specific benchmark numbers underestimate the actual rate of capability advance, because the benchmarks themselves are a lagging indicator.
6. The interpretive numbers that warrant the most skepticism
Five specific Index numbers that are likely to be quoted but should be quoted with explicit confidence intervals.
Number 1 · “$172 billion annual value to U.S. consumers.” This is willingness-to-pay survey data. The trend (median value tripled 2025-2026) is more reliable than the level. Real confidence interval on the dollar amount: probably 50-300 billion. Citation guidance: quote the trend, not the level.
Number 2 · “53% global generative AI adoption in three years.” Adoption definition includes any use of any generative AI tool ever. Sustained-use is much lower (probably 20-30% globally). Citation guidance: clarify what definition of adoption is being used.
Number 3 · “Median value per user tripled between 2025 and 2026.” Same survey methodology as Number 1. Trend more reliable than level. Triple is probably 1.5-4× depending on survey design. Citation guidance: directional reliable, magnitude uncertain.
Number 4 · “U.S. ranks 24th globally at 28.3% adoption.” US ranks lower than expected because high-engagement-but-low-trial markets pull the US down. The country comparison is sensitive to the trial-vs-sustained-use disaggregation. Singapore at 61% is partly a function of survey design. Citation guidance: rank ordering more meaningful than absolute percentages.
Number 5 · “AI’s workforce disruption hits young workers first.” The Index reports this as an observation. The causal pathway between AI adoption and youth employment is much harder to establish than the correlation suggests. Multiple alternative explanations exist (post-pandemic labor market normalization, sector-specific demand shifts, education-to-work pipeline disruptions independent of AI). Citation guidance: treat as correlation, not causation.
7. The numbers that are most reliable and should be quoted
Five Index numbers that are well-supported and can be quoted directly.
Number 1 · Foundation Model Transparency Index 58→40 year-over-year. This is the Index’s own measurement of an explicit construct. The methodology is documented. The trend direction is unambiguous. Citation guidance: quote directly.
Number 2 · Arena Elo top-tier ratings (Anthropic 1503, xAI 1495, Google 1494, OpenAI 1481, Alibaba 1449, DeepSeek 1424). These are aggregated user-preference data from a public platform with standardized methodology. The numbers are precise within the limits of Elo systems. Citation guidance: quote directly, note that closed-vs-open gap (3.3% as of March 2026) is the meaningful structural finding.
Number 3 · Top closed model leads top open model by 3.3%, up from 0.5% in August 2024. This is a precise measurement of a structural shift. Citation guidance: quote directly. This is the open-vs-closed inflection point.
Number 4 · Robots succeed in 12% of real household tasks. This is a precise measurement of a specific gap. Citation guidance: quote directly. This is the most underappreciated number in the Index.
Number 5 · Apollo Go completed 11 million fully driverless rides, 175% YoY increase. This is a public-record disclosure with clean methodology. Citation guidance: quote directly. The Chinese AV deployment scale is consistently underreported in Western coverage.
8. Reading recommendations for different audiences
Different audiences should read the Index with different goals and different levels of methodological skepticism.
For policymakers. Read the policy chapter first. It is the most rigorous and the most directly actionable. Read the public-opinion chapter with skepticism — the framing choices materially affect the policy implications. Read the Foundation Model Transparency Index closely — it is the single most important methodological signal in the entire document. Avoid quoting the consumer-value dollar figure as a fact; quote the trend instead.
For executives. Read the technical-performance chapter for capability benchmarks but anchor on the Arena Elo ratings rather than on individual benchmark scores. The Elo ratings aggregate across users and tasks; individual benchmark scores have known saturation problems. Read the workforce-impact section with extreme skepticism — the data does not support the strong causal claims that often get drawn from it.
For researchers. Read the methodology appendix first, before any chapter. Read the science and medicine chapters carefully — the critical-of-clinical-AI framing is unusual and worth integrating into your own work. Treat the “notable models” geographic distribution as a curated rather than complete picture.
For journalists. Quote the rigorous numbers (Foundation Model Transparency, Arena Elo, robotics 12%, Apollo Go 11M). Avoid quoting the interpretive numbers (consumer value, adoption percentage, workforce displacement) without explicit caveats. When the Index acknowledges its own limits — the jagged frontier framing, the benchmark saturation problem, the limitations of clinical-AI evidence — convey those caveats to readers. The Index’s authority comes partly from its self-criticism; preserving that in citation chains preserves the authority.
For investors. Read the investment chapter for aggregate flows. Disregard the per-company breakdowns; the Index is necessarily incomplete on private-company financials. Read the technical-performance chapter for the Arena Elo ratings and the open-vs-closed gap. Read the science and medicine chapters for sectoral context but do not infer specific investment theses from the Index’s coverage choices.
9. What the 2027 Index should add
Three structural improvements that would make the 2027 Index more useful.
Improvement 1 · Trial-vs-sustained-use disaggregation. Adoption metrics that distinguish first-use from continued-use would substantially improve the geographic and demographic comparisons. Many of the Index’s most-quoted numbers depend on this disaggregation. The data exists in the underlying surveys; the Index just needs to publish it disaggregated.
Improvement 2 · Capability-deployment gap measurement. The gap between what a model can do (benchmark performance) and what it is being deployed for in production environments is currently invisible in the Index. A new chapter or section measuring the deployment-lag — the time and friction between capability advance and economic translation — would surface a structural fact that benchmark-anchored progress narratives miss.
Improvement 3 · Multi-frame meta-analysis. The Index currently uses “jagged frontier” as its dominant meta-frame. A 2027 addition that explicitly compares jagged-frontier with capability-overhang, evaluation-gaming, and deployment-lag frames would help readers calibrate which frame fits which sub-domain. This is a methodologically sophisticated move that would distinguish the Index from less rigorous summary documents.
What to Do This Quarter
1. Anyone planning to cite the Index in writing or analysis. Read the methodology appendix first, even if you’ve cited prior editions. The 2026 edition has more rigor on some numbers and more interpretive freedom on others. Quote the rigorous numbers directly; caveat the interpretive numbers; acknowledge the Index’s own self-criticism in your citation.
2. AI labs and research organizations. Use the Foundation Model Transparency Index 58→40 year-over-year drop as institutional pressure to publish more methodology. The Index is the field’s primary authoritative source; visibility in the document depends on willingness to disclose. The labs that disclose more capture more positive framing in the Index. The labs that disclose less capture less.
3. Policymakers reading the Index for regulatory inputs. The policy chapter is the most directly actionable. The public-opinion chapter is the most subject to framing effects. The Foundation Model Transparency Index is the single most important methodological signal. Calibrate your own use of the Index to those gradations.
4. Education and workforce researchers. The workforce-impact framing is the section most subject to causal-attribution problems. Do not use Index workforce numbers as primary citation in original research without first reviewing the underlying source data. The Index is a synthesis; the underlying surveys and labor-market studies are the citation chain to anchor on.
The Strategic Read
The Stanford AI Index 2026 is the most rigorous synthesizing document on artificial intelligence that exists. It is also a curated, partially-vendor-influenced, framing-shaped, audience-targeted document that aggregates disparate methodologies into a single authoritative narrative. Both descriptions are accurate.
The Index’s greatest value is in the categories where it counts cleanly — benchmark performance with appropriate timestamps, foundation model transparency, policy activity across jurisdictions, scientific publication output, clinical AI evidence quality. In these categories, the Index produces numbers that are well-sourced, reproducible, and durable.
The Index’s greatest interpretive risk is in the categories where it summarizes — willingness-to-pay translated into consumer value, adoption percentages that conflate trial and sustained use, workforce-impact framings that imply causation, public-opinion framings that emphasize one side of an ambivalent dataset.
The strategic discipline is to read the Index for what it does well, treat the interpretive claims with proportionate skepticism, and use the Index as a starting point for further research rather than as the ending point of citation chains. Stanford HAI’s program would benefit from this kind of critical reception. So would the policy and executive communities who otherwise cite the Index uncritically. The Index’s authority creates the obligation to audit it. This dispatch is one such audit.
The 2027 Index will have additional improvements. The methodology constraints identified here are not permanent. Trial-vs-sustained-use disaggregation, capability-deployment gap measurement, and multi-frame meta-analysis would each materially improve the document. The Stanford HAI team is intellectually honest enough to absorb constructive criticism and adjust. The audit is meant in that spirit.
The Stanford AI Index 2026 is rigorous on what it counts and interpretive on what it summarizes. Quote the counts directly. Caveat the summaries. Read the methodology appendix before any chapter. The Index’s authority creates the obligation to audit it. The audit produces a more useful document, not a less useful one.
About the Author
Thorsten Meyer is a Munich-based futurist, post-labor economist, and recipient of OpenAI’s 10 Billion Token Award. He spent two decades managing €1B+ portfolios in enterprise ICT before deciding that writing about the transition was more useful than managing quarterly slides through it. More at ThorstenMeyerAI.com.
Related Dispatches
- Forward-Deployed Engineer Economics 2.0 — the unit economics math
- The Anthropic IPO Disclosure Document — what the S-1 has to say
- The Compute Concentration Audit — sovereign wealth funds notice
- The 2028 Model Lab Endgame — scenario forecast
- The Memento Constraint — continual learning bottleneck
- Single Digits — the open-weight inflection
Sources
- Stanford HAI, 2026 AI Index Report (April 2026, ninth edition, 400+ pages)
- Stanford HAI, Inside the AI Index: 12 Takeaways from the 2026 Report
- IEEE Spectrum, Stanford’s AI Index for 2026 Shows the State of AI (April 2026)
- R&D World Online, Stanford HAI 2026 AI Index: AI posts gains in science and medicine while often struggling to read a clock
- Stanford HAI, Technical Performance Chapter — Arena Elo ratings, benchmark trajectories
- Stanford HAI, Science Chapter — PaperArena, BixBench, ReplicationBench, UnivEarth, ChemBench data
- Stanford HAI, Medicine Chapter — clinical AI evidence base review (500+ studies)
- Epoch AI, notable models curation methodology
- Yoav Shoham et al., Foundation Model Transparency Index (2024-2026)
- Quote from Ray Perrault, AI Index Co-Chair, on benchmark-to-real-world translation
- Sha Sajadieh, AI Index Lead, public commentary on 2026 findings