
By Thorsten Meyer — May 2026
May 20, 2026 — fourteen days from publication of this dispatch — NVIDIA reports Q1 FY27 earnings. The number that matters most is approximately $78 billion in revenue, which Jensen Huang guided in February’s Q4 FY26 print. That guidance beat the $72.6 billion consensus by 7.4 percent and explicitly excluded any China data center compute revenue (estimated at approximately $50 billion annually). Huang’s GTC 2026 commentary in March pushed the demand visibility further: “Right here where I stand, I see through 2027, at least $1 trillion” in Blackwell and Vera Rubin orders — double the $500 billion figure he cited at GTC 2025. The Rubin platform launches in late 2026 with stated 10× reduction in inference token cost vs. Blackwell. NVIDIA’s market cap reached approximately $5.2 trillion in late April 2026; the stock pulled back into earnings as investors assess whether the $1 trillion demand story converts to revenue on schedule.
This is the single most consequential earnings print in 2026 tech. NVIDIA captures 90+ percent share of data center GPU revenue. Its Q1 print is the cleanest proxy available for the health of the entire AI infrastructure thesis — the $725B hyperscaler capex commitment, the demand pull from agentic AI / robotics / sovereign AI, the architecture transition timing, the NVIDIA-vs-in-house-silicon competitive dynamic, and the bubble-vs-durable-value question disentangled in the prior dispatch. Reading the print correctly requires understanding what each line item means, what variance from expectations would signal, and how the result connects to the structural threads from the prior dispatches.
This dispatch is the framework for reading May 20. The variables that matter, the signals embedded in each, and the strategic implications by stakeholder. The dispatch on the bubble question flagged NVIDIA addressable share as one of the three contested middle categories that resolves the question. The dispatch on the $725B hyperscaler capex flagged in-house silicon migration as risk vector 3. The dispatch on the power bottleneck flagged the constraint that compounds capex deployment timing. The dispatch on the China Sphere capability gap covered the geopolitical fragmentation that affects NVIDIA’s addressable revenue. Q1 FY27 earnings touches every thread.
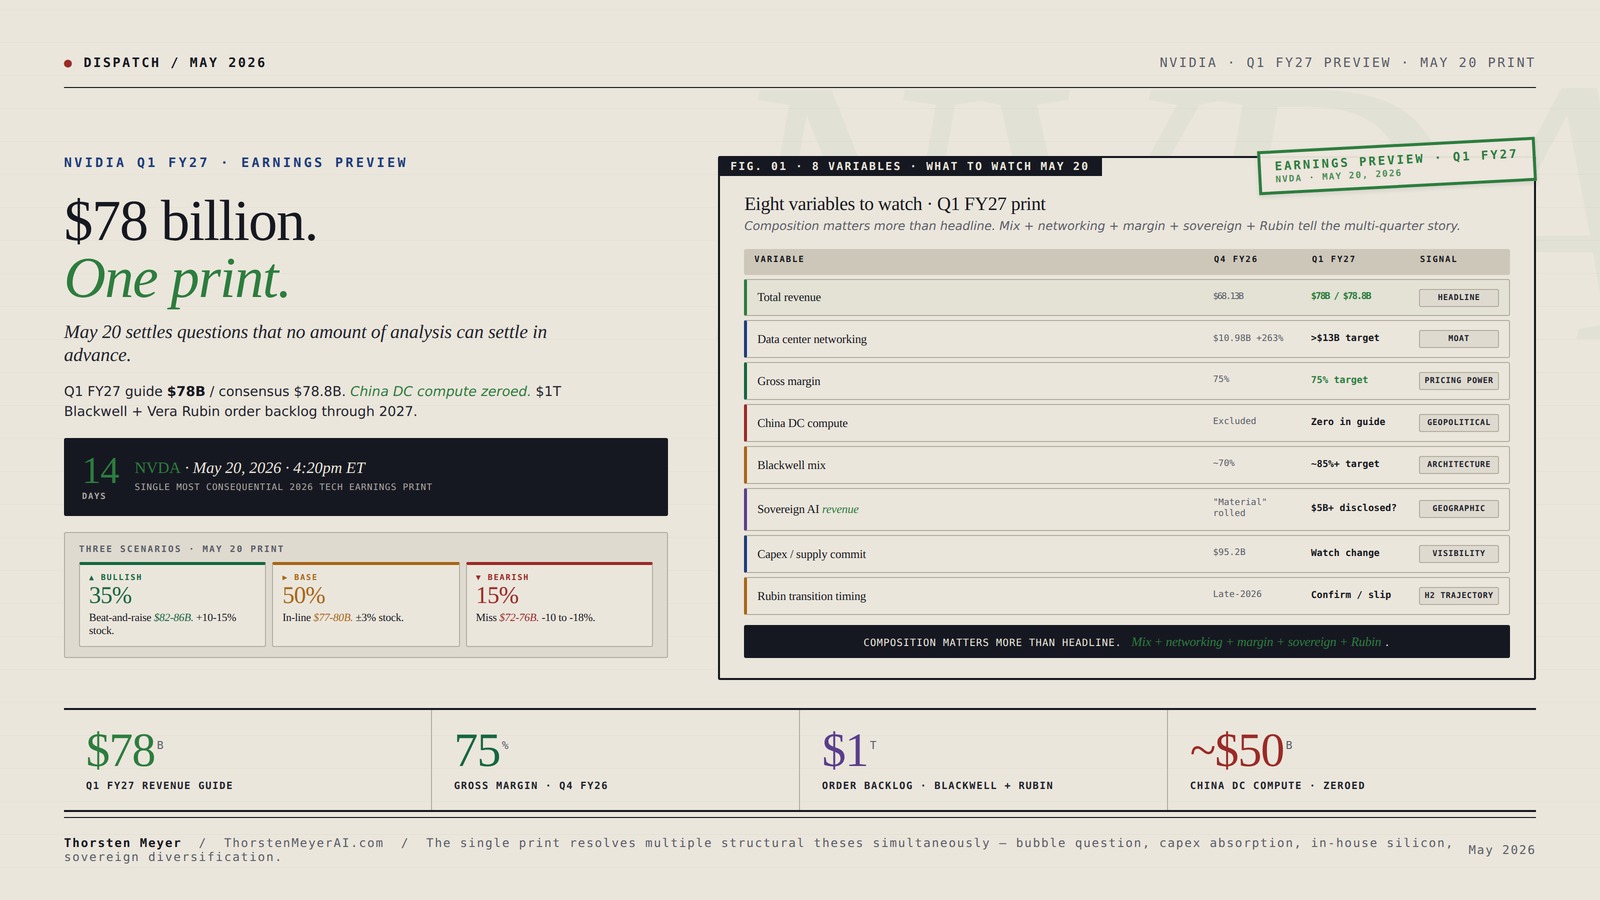
$78 billion.
One print. The whole thesis.
May 20 settles questions that no amount of analysis can settle in advance.
Q1 FY27 guide $78B / consensus $78.8B. Excludes all China data center compute revenue ($50B addressable, zeroed). $1T Blackwell + Vera Rubin order backlog visibility through 2027 per Huang at GTC. The print resolves multiple structural theses simultaneously — bubble question, capex thesis, in-house silicon migration, sovereign AI diversification. Composition matters more than headline.
2026 tech earnings print
Twelve variables. One print.
The composition matters more than the headline. $78B with 87% Blackwell mix and $14B networking is a meaningfully different signal than $78B with 72% mix and $11B networking.
NVIDIA Tesla L4 24GB PCIe Graphics ACELLERATOR HH/HL 75W GPU 900-2G193-0000-000
24GB Video Memory
As an affiliate, we earn on qualifying purchases.
As an affiliate, we earn on qualifying purchases.
Three scenarios. One print.
35/50/15 probability. $5.2T market cap means perfection is partly priced in. Asymmetric risk profile favors reading the print over predicting it.
- Revenue $82-86BBeating $78B guide by 5-10%.
- 87% Blackwell mixNetworking $13-15B.
- 75% margin holdsPricing power intact.
- Sovereign AI $5-8BGeographic diversification confirmed.
- Outcome: Stock +10-15%. FY27 trajectory $340-360B.
- Revenue $77-80BIn-line with $78B guide.
- 82-85% BlackwellNetworking $12-13B.
- 74-75% marginStable pricing.
- Sovereign rolled inNot separately disclosed.
- Outcome: Stock -2 to +3%. Continuation trajectory.
- Revenue $72-76B3-7% below guide.
- 75-80% BlackwellSupply-constrained.
- 73-74% marginPricing pressure visible.
- FY27 30-50% YoY decelQ2 guide soft.
- Outcome: Stock -10 to -18%. Bear case gains evidence.
NVIDIA Q1 FY27 is not a standalone earnings event. It is a structural test of multiple theses that the dispatch series has identified — bubble question, capex absorption, in-house silicon migration, sovereign diversification. The single print resolves several uncertainties at once.

Personal AI Servers: A Guide to Building Private AI Infrastructure for Secure, Offline and Self-Hosted Local LLMs for Data Privacy
As an affiliate, we earn on qualifying purchases.
As an affiliate, we earn on qualifying purchases.
Four assignments. By role.
Avoid concentrated pre-earnings positioning.
$5.2T market cap means perfection partly priced in. Even meeting expectations may produce limited upside; missing expectations produces material downside. Dollar-cost averaging or option strategies (puts as hedge, calls for upside capture) more appropriate than concentrated bets either direction. The print itself is the data point to act on, not anticipate.
Use May 20 to recalibrate broader exposure.
NVIDIA’s print is the strongest single read on the hyperscaler capex thesis. Meaningful beat reduces impairment-cycle probability for hyperscalers. Miss elevates it. Position broader AI infrastructure exposure (CoreWeave, Oracle, second-tier) based on May 20 result. Bubble question dispatch provides framework for differentiating durable-value from frothy-category names.
Read NVIDIA customer commentary as indirect signal.
NVIDIA’s customer commentary indirectly reveals hyperscaler deployment health. Strong commentary supports $725B capex thesis. Mixed or weakening commentary signals buildout pace may be moderating. Differentiate Microsoft (UAE+nuclear), Alphabet (TPU+SMR), Amazon (Trainium), Meta (most exposed) by power/silicon strategy quality.
Plan API pricing around Rubin trajectory.
NVIDIA Q1 FY27 reveals cost structure for AI inference at production scale. Rubin’s 10× reduction in inference token cost — if confirmed — directly improves AI lab unit economics through 2027. Schedule API price changes accordingly. Anthropic IPO disclosure flagged margin compression risk; Rubin economics partially offset that risk.

NVIDIA Video Card 900-22080-0000-000 Tesla K80 24GB DDR5 PCI-Express Passive Cooling Brown Box NCNR.
Colour: brown
As an affiliate, we earn on qualifying purchases.
As an affiliate, we earn on qualifying purchases.
Executive Summary · The Variables in One Table
| Variable | Q4 FY26 actual | Q1 FY27 guide / consensus | What variance signals |
|---|---|---|---|
| Total revenue | $68.13B (+73% YoY) | $78B guide / $78.8B consensus | Top-line acceleration vs deceleration |
| Data center revenue | ~$56B (+85% YoY) | ~$66-70B implied | Hyperscaler buildout health |
| Data center networking | $10.98B (+263% YoY) | Analyst focus | NVLink fabric standardization |
| Gross margin (non-GAAP) | 75% | 75% target | Pricing power amid Blackwell ramp |
| EPS (non-GAAP) | $1.62 | $1.78 consensus | Earnings translation efficiency |
| China DC compute | Excluded post-H20 charge | Zero in guide | Geopolitical baseline |
| Blackwell mix vs Hopper | ~70% Blackwell | ~85%+ Blackwell | Architecture transition pace |
| Forward Q2 FY27 guide | — | Watched closely | Trajectory through Rubin transition |
| Q1 FY27 customer concentration | Top 4 ~50% of DC | Watch for change | Diversification or concentration |
| Sovereign AI revenue | “Material” but unspecified | Specific number expected | Geographic addressable expansion |
| Capex / supply commitments | $95.2B | Watch for change | Forward-demand visibility |
| FY27 full-year revenue trajectory | — | Implied by Q2 guide | $300B+ scenario validation |
The print will resolve five questions that the prior dispatches identified as the key forward-looking uncertainties. Whether the $1T order backlog is converting to recognized revenue on schedule (capex thesis). How fast the Blackwell-to-Rubin transition is happening (architecture transition timing). Whether sovereign AI revenue is meaningful as Huang has been signaling (geographic diversification). Whether gross margins are holding through the architecture transition (pricing power). Whether the China revenue gap is narrowing or widening (geopolitical baseline). The combination of these answers determines whether the bull case (~$300B+ FY27 revenue) or the bear case (deceleration to 30-50% YoY growth) materializes.

AI in Embedded Systems: Types, Techniques, Machine Learning, Model Training vs. On-device Inference, Algorithms, Frameworks and Tools.
As an affiliate, we earn on qualifying purchases.
As an affiliate, we earn on qualifying purchases.
1. The headline number · what beating $78B vs missing means
The $78 billion guide is the most-watched number on May 20. The variance from this number is the dominant near-term price driver.
Beating the guide meaningfully ($82-85B+). A meaningful beat (5-10 percent above guide) would signal that demand is accelerating beyond what management could see in February. The implied FY27 revenue trajectory would be approximately $340-360B (vs the implied $300-320B at guide). Stock action probably +8-15 percent on print, with continued upside through Q2 FY27 guide. The bullish case for the broader hyperscaler capex thesis — that demand absorbs the $725B 2026 capex deployment — gets validated. The bullish case in the bubble question dispatch — that NVIDIA addressable share holds — gets validated. NVIDIA’s $5.2T market cap looks justified at ~24× forward earnings.
In-line with guide ($77-79B). An in-line print signals that February’s demand visibility was accurate. The base case for the $1T order backlog conversion to revenue on schedule. Stock action probably -2 to +3 percent on print depending on Q2 guide and forward commentary. The $725B capex thesis remains in base scenario. Bubble question remains contested — neither the bull case nor the bear case gets new evidence. Continuation of the existing trajectory.
Missing the guide modestly ($73-77B). A modest miss (1-7 percent below guide) would signal supply-chain constraints or demand softness. The most likely structural cause: TSMC CoWoS-L advanced packaging capacity continues to be the binding constraint. Stock action probably -8 to -15 percent on print. The base scenario in the bubble question dispatch gains evidence — NVIDIA growth deceleration consistent with the 30-50 percent FY28 forecast in the dispatch’s base case. The bear case for hyperscaler capex impairment risk starts gaining momentum.
Missing the guide materially ($65-72B). A material miss (8-15+ percent below guide) would signal either substantial supply-chain disruption, demand softness more severe than supply constraints suggest, or hyperscaler capex pulling back faster than visible in Q1 2026 prints. Stock action probably -15 to -25 percent on print. The bearish case in the bubble question dispatch gains substantial evidence. The 2027-2028 impairment cycle becomes the dominant scenario rather than tail risk.
The probability distribution as of May 6: in-line is most likely (~50 percent probability); modest beat (~25 percent); meaningful beat (~10 percent); modest miss (~10 percent); material miss (~5 percent). The skew is asymmetric — the upside scenarios are constrained by supply, the downside scenarios are gated by demand robustness.
2. Data center revenue mix · the architecture transition signal
Within the headline number, the data center revenue split between Blackwell, Hopper (legacy), and networking provides the architecture-transition signal.
Blackwell production ramp. Blackwell shipments crossed 1.5 million units in calendar Q4 2025, with Q1 2026 expected to exceed 2 million units. Average selling price for Blackwell Ultra systems is approximately $40,000 — well above prior generations. The 88 percent of total revenue that comes from data center is approximately $66-70B; if Blackwell mix exceeds 85 percent of new shipments, the architecture transition is on track. If Blackwell mix lags at 70-75 percent, supply constraints are binding harder than anticipated.
Networking momentum. Q4 FY26 data center networking revenue was $10.98B, up 263 percent year-over-year. The 263 percent growth signals NVLink fabric becoming the default standard for trillion-parameter inference. Q1 FY27 networking revenue >$13B would confirm continued acceleration. The networking growth rate matters because it is the leading indicator for full-stack lock-in — once a hyperscaler standardizes on NVLink at fabric scale, switching costs to alternative architectures (AMD, custom silicon) increase substantially. Networking revenue is the structural moat indicator more than GPU revenue is.
Sovereign AI line item. Huang has been explicitly signaling sovereign AI deployments as a meaningful growth vector. Notable deals include 10,000 Blackwell GPUs for Foxconn / Taiwan supercomputer factory, 18,000 GB300 Blackwell chips for Saudi Arabia’s Humain (covered in the EU AI Sovereignty dispatch sovereign deployment context), Trump administration consideration of more than 1 million advanced NVIDIA chips for UAE. If Q1 FY27 breaks out sovereign AI revenue specifically — which would be a new disclosure — and the number is $5B+ for the quarter, the geographic diversification thesis gains material support. If sovereign AI remains rolled into general “data center” without specific disclosure, the diversification narrative remains less verifiable.
Customer concentration. In Q4 FY26, the top four hyperscalers accounted for approximately 50 percent of data center revenue. The other 50 percent comes from second-tier cloud (CoreWeave, Lambda, Crusoe), enterprise, sovereign, and emerging markets. Watch for changes in this concentration. Increasing concentration signals enterprise / sovereign demand is not scaling as the bullish case requires. Decreasing concentration signals genuine demand-base diversification, which de-risks the hyperscaler-impairment scenario.
The cumulative picture: the data center mix is more informative than the headline. A $78B headline with 87 percent Blackwell mix and $14B networking is a meaningfully different signal than a $78B headline with 72 percent Blackwell mix and $11B networking. The composition reveals whether demand is durable or supply-constrained-only.
3. Gross margin · the pricing power test
NVIDIA’s 75 percent gross margin (non-GAAP) is the structural-pricing-power indicator. The Q1 FY27 print on this dimension is one of the most important.
Why margins matter more than revenue here. Revenue can be supported by demand even with declining unit economics. Margin reveals whether NVIDIA retains pricing power as competitive dynamics evolve. If Blackwell margins hold at 75+ percent through the production ramp, NVIDIA’s pricing power is structurally intact. If margins compress to 70-72 percent, pricing pressure from in-house silicon migration (Google TPU, Amazon Trainium / Inferentia, Microsoft Maia, Meta MTIA) is starting to bite. If margins compress below 70 percent, the pricing-power thesis is in trouble.
The forward visibility. Management commentary on Rubin pricing dynamics will matter. Rubin delivers 10× reduction in inference token cost vs Blackwell — which can be marketed as customer value (justifying premium pricing) or interpreted as commoditization (forcing pricing compression). The framing in management commentary signals which path NVIDIA is pursuing. Premium-positioning Rubin (held margin assumption) implies the bull case for pricing power. Cost-leadership-positioning Rubin (declining margin assumption) implies the bear case.
The competitive context. AMD’s MI400 series is in volume production with reported 20-30 percent price-performance advantage on specific inference workloads. Custom silicon at hyperscalers continues to scale (15-25 percent of inference workloads in Q1 2026, projected 30-45 percent by 2028). The pricing pressure is real and structural. NVIDIA’s response will be a combination of architecture improvements (Rubin, Vera Rubin Ultra, Feynman) and software-stack lock-in (CUDA platform improvements, NVLink fabric standardization). Whether these defenses preserve the 75 percent margin or whether competitive pressure compresses it through 2027 is the structural question.
Margin trajectory through FY27. The full-year FY27 trajectory matters more than the single-quarter print. A pattern where Q1 prints 75 percent and the company guides to 73-74 percent for Q2-Q4 would signal modest pricing pressure starting. A pattern where Q1 prints 75 percent and Q2 guide stays at 75 percent would signal continued pricing power. The cumulative signal across Q1, Q2 guide, and full-year commentary determines the structural read.
4. The China question · what zero data center compute revenue means
Q1 FY27 guidance explicitly excludes China data center compute revenue. The implications are larger than they appear.
The structural baseline. Huang estimated the addressable Chinese market at approximately $50 billion annually. The Q1 FY27 guidance assumes zero from this. The structural implication: NVIDIA’s $78B guide represents the demand from non-China markets exclusively. If anything, the China gap is conservative — the $50B addressable estimate could grow as Chinese AI deployment scales. The structural read: NVIDIA is being prudent in not including a Chinese revenue stream that geopolitical conditions make uncertain.
The H20 charge precedent. NVIDIA took a $4.5 billion charge on H20 inventory in FY26 when export restrictions tightened. Similar charges are possible if Trump administration policy shifts further. The current administration has signaled both expansion (UAE 1 million chip discussion) and contraction (China restrictions tightening) in different directions. The signal-to-watch on May 20: management commentary on geopolitical environment and any further inventory charge risk.
The China-as-customer counterfactual. Even if China access remains constrained, the broader question is whether Chinese hyperscaler demand creates a parallel competitive dynamic. Chinese frontier labs (DeepSeek, Alibaba Cloud, Tencent, ByteDance) have been transitioning to domestic alternatives (Huawei Ascend, Cambricon, Biren, Moore Threads) faster than originally projected. If Chinese hyperscalers achieve capability parity with non-NVIDIA hardware over 2026-2027, the global addressable market for NVIDIA contracts permanently rather than temporarily. The May 20 print won’t directly reveal this dynamic, but management commentary on long-term China visibility may.
The asymmetric upside. Trump administration is reportedly considering allowing UAE to import 1+ million NVIDIA chips — far beyond Biden-era restrictions. If China relations soften incrementally — even partial market access — the upside is multi-billion-dollar. The May 20 print won’t settle this, but management commentary on negotiation dynamics may signal direction.
The geopolitical risk asymmetry. The bull case has limited near-term China upside (gradual access expansion). The bear case has substantial downside (further restrictions extending to additional chip generations or to additional jurisdictions). Position sizing should reflect the asymmetry: limited upside if China loosens, larger downside if it tightens.
5. The Rubin transition · what the timing reveals
Vera Rubin platform launches in late 2026. The Q1 FY27 print is the last major data point before launch.
The architectural significance. Rubin is built on TSMC’s 3nm process with 336 billion transistors — nearly double Blackwell’s density. Performance characteristics: 10× reduction in inference token cost, 4× fewer GPUs required to train mixture-of-experts models vs Blackwell. The architectural advance is meaningful and arrives on schedule for an annual cadence (Hopper → Blackwell → Blackwell Ultra → Rubin → Rubin Ultra → Feynman). The cadence itself is structurally important — competitors cannot match annual architecture upgrades at NVIDIA’s scale.
The customer transition signal. AWS, Google Cloud, Microsoft Azure, and Oracle Cloud are all “first-wave Vera Rubin deployers” per management commentary. Q1 FY27 will reveal whether the first-wave deployment is on schedule for late 2026 or whether the timeline has slipped. Watch for: any commentary on Rubin sample shipments to launch partners, any commentary on production ramp targets, any commentary on early customer feedback. A confirmation that Rubin is on track for late 2026 production materially de-risks the FY27 H2 trajectory. A signal of delay shifts FY27 H2 into Blackwell-tier economics, which compresses revenue growth.
The Blackwell-to-Rubin transition risk. Architecture transitions historically produce some quarter where customers pause purchases of the older generation in anticipation of the newer one. The “air pocket” risk: Q3-Q4 FY27 could see Blackwell demand softness as customers wait for Rubin production. Management will likely address this risk in Q1 FY27 commentary. The mitigating factor: Blackwell Ultra and Rubin are positioned as complementary (Blackwell Ultra for current production workloads, Rubin for next-generation training and inference) rather than substitutionary. If management commentary supports the complementary framing, the air-pocket risk is reduced. If commentary suggests Blackwell demand softening into Rubin transition, the risk is real.
The competitive timing. Custom silicon roadmaps from hyperscalers (Trainium 2/3, TPU v6/v7, Maia 200, MTIA v2/v3) are also advancing through 2026-2027. The relative timing between NVIDIA’s Rubin launch and competitor production ramp determines the architectural-leadership window. If Rubin ships on schedule and competitors slip, NVIDIA’s CUDA + architectural lead extends. If Rubin slips and competitors execute, the lead compresses faster.
6. The capex commitment · what $95.2B in supply commitments means
NVIDIA’s balance sheet shows $95.2 billion in supply commitments. The number is structurally important and underexamined.
What the commitment represents. Supply commitments are NVIDIA’s contractual obligations to TSMC for wafer capacity, to memory suppliers (SK Hynix, Micron, Samsung) for HBM3E and HBM4 capacity, and to packaging providers (TSMC CoWoS-L, Amkor) for advanced packaging. The $95.2B represents forward purchasing locked in through 2027-2028. The size signals NVIDIA’s confidence in continued demand at current trajectory.
The risk asymmetry. If demand softens, NVIDIA still has to absorb the supply commitments — which would compress margins and potentially force inventory writedowns. The $4.5B H20 charge in FY26 was a precursor of this dynamic. A demand softening of 10-15 percent against $95.2B in supply commitments could generate $5-15B in additional inventory charges. The risk is real but bounded by the diversification of the supply base across multiple chip generations.
The bull-case interpretation. $95.2B in supply commitments at current trajectory implies continued production scaling that would support FY28 revenue of $400-500B at current pricing — consistent with Huang’s “$1 trillion through 2027” Blackwell + Vera Rubin order backlog. The commitment level is consistent with demand visibility through 2027.
The bear-case interpretation. $95.2B in supply commitments creates constraint-driven exposure. If anything goes wrong (China restrictions tighten, in-house silicon scales faster, demand softens), the commitments amplify the impact. The bear case in the bubble question dispatch gains specific magnitude through this lens — $95.2B in contractually-locked supply against a demand environment that may compress.
What May 20 will reveal. Watch for any change in the supply commitment number. An increase to $110-130B signals further demand visibility. A decrease to $80-90B signals management is reducing forward exposure. Stability around $95B signals continued execution at current trajectory.
7. The connections to other dispatches
NVIDIA Q1 FY27 connects to multiple structural threads from this dispatch series.
Connection 1 · The bubble question disentanglement. The dispatch flagged NVIDIA addressable share as one of three contested middle categories that resolve the question. Q1 FY27 is the next data point. A meaningful beat with margin holding at 75 percent supports the bull case (CUDA moat persists, addressable share holds). A miss with margin compression supports the bear case (in-house silicon migration accelerates, addressable share compresses).
Connection 2 · The hyperscaler capex thesis. The capex dispatch covered the $725B 2026 commitment. NVIDIA is the largest single beneficiary in absolute dollar terms. Q1 FY27 reveals whether the capex is converting to NVIDIA revenue at the rate that justifies the $5.2T market cap. In-line or beat supports the capex absorption thesis; miss signals capex absorption shortfall.
Connection 3 · The power bottleneck. The bottleneck dispatch covered the constraint that compounds capex deployment timing. Q1 FY27 commentary on hyperscaler deployment pace will indirectly reveal whether power constraint is creating deployment delays. If hyperscaler customers are pausing GPU orders due to power-availability gaps, NVIDIA revenue grows slower than the architectural cadence would otherwise support.
Connection 4 · The China Sphere capability gap. The dispatch covered the geopolitical fragmentation. Q1 FY27 commentary on China visibility, sovereign AI revenue, and competitive dynamics with Chinese chips reveals the structural fragmentation pattern. Specific sovereign AI numbers, if disclosed, partially offset the China revenue gap.
Connection 5 · The compute concentration audit. The dispatch covered AWS / Azure / GCP structural concentration. NVIDIA’s hyperscaler customer concentration is the parallel. Q1 FY27 reveals whether top-4-hyperscaler concentration is increasing (consistent with concentration thesis) or decreasing (consistent with sovereign / enterprise diversification).
Connection 6 · The continual learning research map. The dispatch covered the architectural bottleneck for production AI. NVIDIA’s Rubin platform with 10× inference cost reduction directly addresses one of the production-deployment economic constraints. If Rubin ships on schedule, the economics for production CL improve materially through 2027-2028.
Connection 7 · The agentic loop failure modes. The dispatch covered taxonomy of failure modes. Agentic AI is one of NVIDIA’s positioned demand drivers. Huang’s commentary that “the agentic AI inflection point has arrived” reflects this. Q1 FY27 will reveal whether agentic-AI-driven inference demand is materializing in the magnitudes the bull case requires.
The cumulative picture: Q1 FY27 is not a standalone earnings event. It is a structural test of multiple theses that the dispatch series has identified. The single print resolves several uncertainties at once.
8. Three scenarios for May 20 print and aftermath
The May 20 print resolves into one of three structural patterns.
Bullish scenario · 35% probability · “Beat-and-raise validates the bull case.” Revenue prints at $82-86B, beating the $78B guide by 5-10 percent. Data center revenue at $70-74B with networking at $13-15B. Blackwell mix at 87+ percent. Gross margin holds at 75 percent. Q2 FY27 guide at $86-92B implies FY27 trajectory at $340-360B. Sovereign AI revenue disclosed at $5-8B. Stock action +10-15 percent on print, continued strength through Q2. The bull case in the bubble question dispatch for NVIDIA addressable share gains material support. The hyperscaler capex thesis demand-pull validation is concrete.
Base scenario · 50% probability · “In-line with constructive forward.” Revenue prints at $77-80B, in-line with $78B guide. Data center at $66-70B with networking at $12-13B. Blackwell mix at 82-85 percent. Gross margin at 74-75 percent. Q2 FY27 guide at $82-86B implies FY27 trajectory at $310-330B. Sovereign AI numbers grouped with general data center, not separately disclosed. Stock action -2 to +3 percent on print depending on Q2 guide commentary. The base case in the bubble question dispatch gains moderate support — neither bull nor bear thesis materially advanced.
Bearish scenario · 15% probability · “Miss with deceleration signal.” Revenue prints at $72-76B, missing $78B guide by 3-7 percent. Data center at $62-66B with networking at $11-12B. Blackwell mix at 75-80 percent (supply-constrained). Gross margin at 73-74 percent (some pricing pressure visible). Q2 FY27 guide at $76-82B implies FY27 deceleration to 30-50 percent YoY. Stock action -10 to -18 percent on print. The bear case in the bubble question dispatch gains substantial momentum — NVIDIA addressable share compression starts becoming visible. The 2027-2028 capex impairment bear scenario gains specific evidence.
The 35/50/15 probability allocation reflects current setup conditions. Setup factors favoring the bullish scenario: $1T order backlog visibility, sovereign AI deal flow, Blackwell production ramping, continued hyperscaler capex commitments. Setup factors favoring the bearish scenario: TSMC CoWoS-L packaging constraints, China zero baseline already priced in, in-house silicon scaling, $5.2T market cap setting high expectations.
9. The strategic implications by stakeholder
The Q1 FY27 print has direct consequences for five distinct stakeholder groups.
For NVIDIA investors. May 20 is the binary catalyst. Position sizing decisions before earnings should reflect the asymmetric risk profile: $5.2T market cap means perfection is partly priced in, so even meeting expectations may produce limited upside while missing expectations produces material downside. Dollar-cost averaging or option strategies (puts as hedge, calls as upside capture) are more appropriate than concentrated position changes pre-earnings. The earnings print itself is the data point to act on, not to anticipate.
For broader AI infrastructure investors. NVIDIA’s print is the strongest single read on the hyperscaler capex thesis. A meaningful beat reduces the impairment-cycle probability for hyperscalers. A miss elevates it. Position broader AI infrastructure exposure (CoreWeave, Oracle, second-tier data center plays) based on May 20 result rather than anticipating it. The bubble question dispatch provides the framework for differentiating durable-value names from frothy-category names.
For hyperscaler investors. NVIDIA’s customer commentary will indirectly reveal hyperscaler deployment health. Strong customer commentary supports the hyperscaler capex thesis. Mixed or weakening customer commentary signals that hyperscaler buildout pace may be moderating. The $725B capex dispatch framework applies.
For AI labs (Anthropic, OpenAI, others). NVIDIA’s Q1 FY27 reveals the cost structure for AI inference at production scale. Rubin’s 10× reduction in inference token cost — if confirmed in management commentary — directly improves AI lab unit economics through 2027. Schedule API price changes accordingly. The Anthropic IPO disclosure dispatch flagged margin compression as a forward-risk factor; Rubin economics partially offset that risk.
For policymakers. NVIDIA’s commentary on China dynamics and sovereign AI deals will inform policy. Specific sovereign deal numbers (Saudi Humain, UAE, Foxconn / Taiwan) reveal the geographic pattern of AI infrastructure deployment. The EU AI Sovereignty dispatch framework applies. Trade policy decisions for late 2026 should factor in the demand pattern revealed in Q1 FY27.
What to Do This Quarter (Through May 20)
1. Pre-earnings positioning. Avoid concentrated position changes in NVIDIA pre-earnings. Asymmetric risk profile means perfection is partly priced in. Use dollar-cost averaging or options structures rather than concentrated bets either direction.
2. Watch the data center mix. Headline revenue tells you less than data center mix. Networking growth >$13B, Blackwell mix >85 percent, sovereign AI disclosure at $5B+ would be the bullish trifecta. Inversely, networking <$12B with mix lagging at <80 percent signals constraints.
3. Read management commentary on Rubin. The Rubin transition is the single most important forward-looking variable. Confirmation of late-2026 production schedule materially de-risks H2 FY27. Any signal of delay shifts the entire trajectory.
4. Position broader AI exposure based on May 20. NVIDIA is the cleanest single proxy for the AI infrastructure thesis. Use the print to recalibrate exposure across hyperscalers, AI labs, second-tier infrastructure, and pure-play AI names. Don’t anticipate; act on the print.
The Strategic Read
NVIDIA Q1 FY27 earnings on May 20, 2026 is the single most consequential earnings print in 2026 tech. The headline number ($78B guide / $78.8B consensus) is the dominant near-term price driver. The composition matters more than the headline — Blackwell mix >85 percent + networking >$13B + sovereign AI disclosure at $5B+ supports the bull case; lagging mix with networking <$12B signals supply constraints biting harder. Gross margin at 75 percent confirms structural pricing power; compression to 70-72 percent signals in-house silicon migration starting to bite.
The China question is structural baseline — Q1 FY27 guide assumes zero data center compute revenue from China. Huang estimated the addressable Chinese market at approximately $50B annually, effectively zeroed in current guidance. Asymmetric geopolitical risk: limited near-term upside if China access expands, larger downside if restrictions tighten further. The H20 charge precedent ($4.5B in FY26) sets the framework for additional inventory writedown risk.
The Rubin transition is the most important forward-looking variable. Late-2026 production schedule materially de-risks H2 FY27 trajectory. Annual architectural cadence (Blackwell → Rubin → Vera Rubin Ultra → Feynman) is structurally important — competitors cannot match. The $95.2B in supply commitments locks in the trajectory at scale; if demand softens, the supply commitments amplify the impact through inventory charges.
Three scenarios resolve through May 20. Bullish (35%): beat-and-raise to $82-86B with 87 percent Blackwell mix, 75 percent margin, $5-8B sovereign AI, +10-15 percent stock action. Base (50%): in-line at $77-80B with stable composition, ±3 percent stock action. Bearish (15%): miss to $72-76B with mix and margin signs of pressure, -10 to -18 percent stock action and structural deceleration signal.
The connection to broader threads runs deep. The bubble question disentanglement flagged NVIDIA addressable share as one of three contested middle categories that resolves the bubble question. The $725B capex dispatch flagged in-house silicon migration as risk vector 3. The power bottleneck dispatch identified the deployment-timing constraint that affects NVIDIA customer commentary. The China Sphere dispatch identified the geopolitical fragmentation that frames the China baseline. Q1 FY27 touches every thread.
The strategic implications run by stakeholder. NVIDIA investors should avoid concentrated pre-earnings positioning given asymmetric risk. AI infrastructure investors should use May 20 result to recalibrate exposure rather than anticipating it. Hyperscaler investors should read NVIDIA customer commentary as indirect signal on hyperscaler buildout health. AI labs should plan API pricing around Rubin’s 10× cost reduction trajectory. Policymakers should factor sovereign AI deal pattern into trade policy.
The deeper signal: NVIDIA Q1 FY27 is the empirical test of multiple theses simultaneously. The single print resolves uncertainties about the AI buildout that the dispatch series has been tracking through structural analysis. May 20 settles questions that no amount of analysis can settle in advance. Position to read the result rather than to predict it.
The honest assessment: the most likely scenario is the base case — in-line print, continuing trajectory, modest stock action. The probability of either tail outcome (meaningful beat or miss) is meaningful but lower. The structural insight is that the print is more important for what it reveals about composition (mix, networking, margin, sovereign AI, customer concentration) than for the headline number alone. The composition tells a multi-quarter story that the headline cannot.
NVIDIA Q1 FY27 earnings May 20, 2026. $78B guide / $78.8B consensus. Composition matters more than headline. Blackwell mix + networking + margin + sovereign AI + China commentary collectively reveal the structural state. Three scenarios with 35/50/15 probability allocation. The single print resolves multiple structural theses simultaneously.
About the Author
Thorsten Meyer is a Munich-based futurist, post-labor economist, and recipient of OpenAI’s 10 Billion Token Award. He spent two decades managing €1B+ portfolios in enterprise ICT before deciding that writing about the transition was more useful than managing quarterly slides through it. More at ThorstenMeyerAI.com.
Related Dispatches
- The Bubble Question, Disentangled
- The $725B Hyperscaler Capex Question
- The Power Bottleneck — Grid Cliff 2027-2028
- The China Sphere Capability Gap Q2 Update
- The Anthropic IPO Disclosure Document
- The Compute Concentration Audit
Sources
- NVIDIA Q4 FY26 earnings release · February 2026 — $68.13B revenue, +73% YoY; $78B Q1 FY27 guide
- Jensen Huang GTC 2026 keynote · March 2026 — $1T Blackwell + Vera Rubin order backlog through 2027
- 24/7 Wall St. · 3 Reasons NVIDIA’s Rally Has Room to Run · April 2026 — networking +263% YoY
- 24/7 Wall St. · Nvidia Stock Set for 8% Gain — Bull Case · April 2026 — bull/bear scenario framing
- TIKR · NVIDIA Stock Pulls Back Before May 20 Earnings · May 2026 — $1T demand story conversion
- TECHi · Nvidia Stock — $1 Trillion Order Backlog · April 2026 — Vera Rubin specs (3nm, 336B transistors, 10× inference cost reduction)
- Tickeron · NVIDIA stock forecast · April 2026 — Q1 FY27 consensus
- LKS Brothers · NVIDIA Q1 2026 earnings preview — Blackwell shipment and ASP details
- ARTVOICE · NVIDIA all-time-high analysis — sovereign AI deal context (Saudi Humain 18,000 GB300, Foxconn / Taiwan 10,000 Blackwell, UAE 1M chip discussion)
- NVIDIA balance sheet · Q4 FY26 — $95.2B supply commitments, $51.1B net cash, 71.1% gross margin
- Dev Journal · NVIDIA 21-day outlook · May 2026 — Beta 2.24, FCF $96.68B
- CNBC · NVIDIA GTC 2026 coverage · March 2026 — Huang $1T order visibility statement