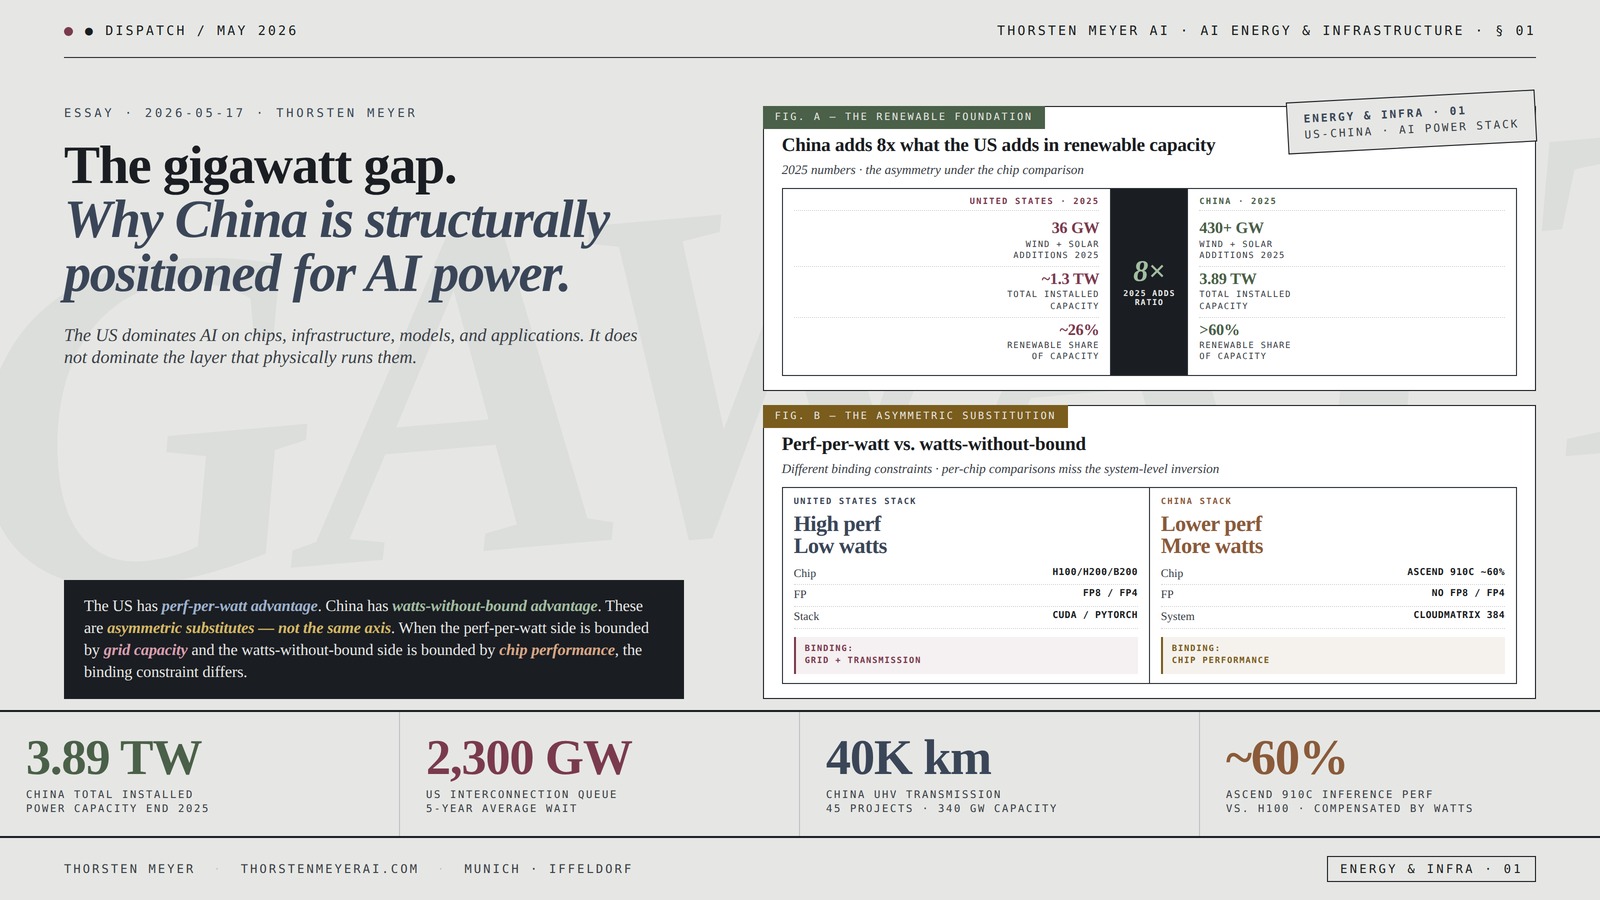

The United States dominates AI on chips, infrastructure, models, and applications. It does not dominate the one layer that physically runs them. New frontier AI data centers now require 100 megawatts to start and 1–2 gigawatts at full buildout, with the largest single-site projects (Meta’s Hyperion, OpenAI’s Stargate, AWS Indiana) targeting 2–12 GW each.
The American power stack reaches that scale through behind-the-meter deals, off-grid gas turbines, nuclear-restart contracts, regulatory arbitrage into ERCOT, and a 2,300-gigawatt interconnection queue with five-year wait times. China reaches that scale through a different mechanism entirely. The NDRC’s Eastern Data Western Compute initiative routes eastern AI demand to western renewable hubs across 45 ultra-high-voltage transmission projects spanning 40,000+ kilometers (roughly 25,000 miles) at 340 GW cross-regional capacity.
China added 430+ GW of wind and solar in 2025 alone — approximately eight times what the US added — pushing combined installed renewable capacity above 1.8 terawatts and total installed capacity to 3.89 TW. Even though Chinese AI chips (Huawei’s Ascend 910C, currently the most-deployed domestic alternative) perform at approximately 60% of NVIDIA H100 inference levels and lack native FP8/FP4 support, the system-level asymmetry inverts the per-chip comparison: where the US optimizes for performance-per-watt, China substitutes raw watts for chip performance, and the substitution works because Chinese power generation scales faster than chip-design constraints contract.
The gap is structural, not technical. It traces to the constitutional difference between US fragmentation (federal–state–local jurisdictional layering with executive-order reactivity) and Chinese centralisation (NDRC + NEA + State Grid + state-owned generators operating under unified mandate). Whether efficiency gains in chips, racks, and models close the gap, or whether the asymmetric substitution compounds, is the open structural question of AI industrial policy in 2026.
The gigawatt gap.
Why China is structurally
positioned for AI power
and the US is engineering
around its grid.
power capacity end 2025
5-year average wait
45 projects · 340 GW capacity
vs. H100 · compensated by watts
interconnection queue
installed capacity
built by end-2024
on-site generation
DY 2024-25 → 2026-27
solar additions 2025
generation capacity
installed base
of capacity
add ratio
2025 alone
capacity end 2025
installed capacity
of capacity
Low watts
grid + transmission capacity
More watts
chip performance / FP precision
The US has perf-per-watt advantage. China has watts-without-bound advantage. These are asymmetric substitutes — not the same axis. When the perf-per-watt side is bounded by grid capacity and the watts-without-bound side is bounded by chip performance, the binding constraint differs.Thorsten Meyer · The Gigawatt Gap · Energy & Infrastructure 01
By Thorsten Meyer — May 2026
This is a structural-economics dispatch on the one layer of the AI stack where the United States is not winning. The argument is not that Chinese chips are better — they are not, and the gap on raw silicon performance is substantial and well-documented. The argument is that chip performance is no longer the binding constraint on AI deployment at frontier scale; power is. And on power, the two countries operate from structurally different positions that the AI infrastructure debate has not yet processed. This essay walks the gigawatt-scale capacity requirements of frontier AI deployments, the American workaround stack that has emerged in response to grid bottlenecks, the Chinese build that operates on a different constitutional foundation, the renewable buildout that underwrites the Chinese position, the chip-versus-power asymmetric substitution that makes per-chip comparisons misleading, the efficiency question of whether US perf/watt gains close the gap, and the structural reading of what this means for AI industrial policy.
The structural argument I want to make: The American AI infrastructure stack has won every layer except the one that physically delivers electrons to silicon. The Chinese AI infrastructure stack has built around a constitutional advantage — centralised planning at infrastructure scale, co-located with the world’s largest renewable buildout, transmitted across the world’s most extensive UHV grid — and is using that advantage to substitute power throughput for chip performance in ways that change what “AI capability at scale” means. Efficiency gains in chips, racks, and models accrue to both sides; the gigawatt gap does not. This is not a technology question; it is a state-structure question, and the answer the next 24 months produces will determine whether the US AI stack remains globally dominant or whether the bottleneck at the power layer becomes a structural ceiling.
The headline integrative finding: The US AI buildout is constrained at the layer where physical infrastructure has to be permitted, sited, and energised. China is not constrained at that layer. China is producing chips that are individually less capable than US chips, but is deploying them across power infrastructure that operates without the regulatory and transmission constraints the US is engineering around. The asymmetric substitution — less perf per chip, more chips powered by more renewable generation transmitted over more UHV miles — is closing the system-level gap faster than the per-chip gap is widening. Whether the US closes the gap through efficiency, statutory reform, or some combination, or whether the constitutional fragmentation produces a sustained ceiling, is the question. There is no single answer, and anyone offering one is selling something.
I · The gigawatt scale · what AI infrastructure now requires
The empirical crystallization of what changed. Frontier AI data centers in 2025–2026 are no longer megawatt-scale facilities. They are gigawatt-scale industrial sites that operate at the unit economics of power generation, not the unit economics of computing.
What the scale numbers actually look like
The starter scale: 100 MW is now the entry-level capacity for a serious AI training site. OpenAI’s partnership with Tata in India begins with 100 MW and targets 1 GW. Per-building capacity at frontier sites runs roughly 500 MW (Meta Hyperion’s 11 buildings will deliver 5 GW total).
The frontier-site scale: 1–2 GW is the “sweet spot for a training site,” per Brad Heyde, OpenAI’s head of infrastructure deployment, because back-end network distances above 2 GW start causing latency problems even on perfectly flat land. Above 2 GW, sites either go multi-story or split.
The campus-aggregate scale: 5 GW is now common for full-buildout single-campus targets. Meta’s Hyperion in Louisiana: 5 GW across 4 million square feet, “covering a significant part of Manhattan’s footprint” per Zuckerberg. Stargate Abilene first phase: 1.2 GW operational since September 2025, housing 450,000+ NVIDIA GB200 GPUs. Stargate’s Doña Ana, New Mexico site could grow to 4.5 GW at full buildout.
The corporate-aggregate scale: 7–12 GW is the multi-year hyperscaler target. Stargate is on track for 10 GW total, with five new sites announced September 2025 bringing planned capacity to nearly 7 GW and $400B+ in cumulative investment. AWS plans to quadruple from 3 GW to 12 GW of US data center capacity, with the Indiana campus alone reaching 2.2 GW across 23 buildings. Meta targets 10+ GW total by end of 2026. Microsoft is currently the most capacity-constrained hyperscaler, building 2 GW per year globally and acknowledging it is turning away customers due to power shortages.
The unit-economics observation
At 1 GW, an AI data center consumes roughly the electricity of a city of 750,000. Stargate Abilene’s 1.2 GW peak demand is half the peak system load of El Paso Electric, which serves 465,000 customers. AWS Indiana’s 2.2 GW is roughly half the residential electricity consumption of all Indiana households combined.
The four largest US hyperscalers — Alphabet, Amazon, Meta, Microsoft — collectively committed approximately $650 billion to AI infrastructure in 2025 and 2026. Capital is not the constraint. The constraint is the rate at which transformers can be manufactured, transmission lines permitted, and generation interconnected. As of April 2026, of the 12 GW of new data center power demand announced for 2026 completion, only about one-third has broken ground; the resulting 7 GW shortfall has become the defining metric of the cycle.
The reframe
What was a computing problem in 2023 is an electricity infrastructure problem in 2026. The companies designing frontier AI deployments now spend more time on PPA negotiations, transformer lead times, gas-turbine procurement, and substation permitting than on rack architecture. This is the scale at which the US power stack collides with the constitutional structure of US energy regulation. It is also the scale at which China’s structurally different power stack has a different problem to solve.

Valiant Power Rack Mount Power Strip – 240V 30A Single Phase PDU with Built-in Surge Protector, Volt & Amp Meter for Data Center – 19” Metal Housing, Ears & Fittings Included, 6’ Cable, 6 Outlets
- Reliable Power Distribution: Supports 120V, 125V, or 240V at 15/30A
- Built-in Surge Protector: Minimizes overloads for safety and equipment protection
- Monitoring Displays: Includes volt and amp meters for load monitoring
As an affiliate, we earn on qualifying purchases.
As an affiliate, we earn on qualifying purchases.
II · The American workaround stack · behind the meter and out of the queue
The structural-incentive crystallization. The US grid was not designed for this load profile, and the regulatory structure that governs it was not designed for the urgency. The American hyperscaler response is a layered workaround stack that routes around the grid rather than through it.
The bottleneck baseline
The empirical signature: approximately 2,300 GW of generation and storage capacity actively seeking grid interconnection as of end-2025 — more than the entire installed generating capacity of the United States. Interconnection wait times have more than doubled in 15 years, now averaging five years from request to commercial operation per Lawrence Berkeley National Laboratory analysis. Only 13% of projects that submitted interconnection requests between 2000 and 2019 had reached commercial operation by end-2024.
The PJM capacity-market signal: capacity auction prices jumped from $29/MW-day (DY 2024–25) to $270/MW-day (DY 2025–26) to the FERC cap of $329/MW-day (DY 2026–27). PJM’s Independent Market Monitor attributes roughly 7.9 GW of additional data center demand in 2025/26 and 12 GW in 2026/27, explaining the near-tenfold capacity-cost increase. Retail electricity prices in several PJM territories have risen 15%+ as a direct result.
The workaround layers
Layer 1 · Behind-the-meter PPAs: hyperscalers contract directly with generators on-site, bypassing the wholesale market. The Microsoft–Constellation Three Mile Island Unit 1 restart deal (announced September 2024) reopens 835 MW of nuclear capacity behind the meter. Amazon–Talen Energy at the Susquehanna nuclear plant: 960 MW. The Microsoft–Chevron arrangement (announced 2025) takes this further toward direct gas generation partnerships outside the regulated transmission framework.
Layer 2 · Off-grid gas generation: xAI’s Colossus 2 in Memphis uses dozens of trucked-in temporary gas-turbine generators sited in a suburban neighbourhood. Stargate Abilene has 300 MW of on-site simple-cycle gas turbines for first-phase operation. Meta’s Hyperion is anchored on a $3.2B 2 GW combined-cycle gas plant that Entergy is building specifically for the site — with local Louisiana residents shouldering $550 million of the cost through utility ratemaking.
Layer 3 · On-site share scaling: Cleanview’s February 2026 analysis projects 30% of anticipated data center energy capacity will come from on-site generation, up from effectively zero a year earlier. Founder Michael Thomas forecasts that figure could rise to 50%. In early 2025 virtually all data center power flowed through the public grid; by early 2026, nearly a third of planned new capacity is designed to operate independently of it. Onsite gas generation capacity has reportedly increased approximately 1,800% since 2025.
Layer 4 · Regulatory arbitrage into ERCOT: Texas’s grid is independent of FERC jurisdiction, governed by ERCOT, and operates under more permissive interconnection rules. Texas HB 1500 (2023) introduced an interconnection cost cap that effectively encourages developers to site near existing transmission capacity. The result: Stargate Abilene, Stargate Shackelford, Stargate Milam County, and dozens of smaller sites have all chosen Texas as their first US location. ERCOT-region projects can move from announcement to operation faster than equivalent PJM-region projects by a factor of 2–3x.
Layer 5 · Federal regulatory acceleration: the Department of Energy’s October 23, 2025 Section 403 letter directs FERC to initiate rulemaking on large-load interconnection above 20 MW, with a final-rule deadline of April 30, 2026. FERC’s December 18, 2025 order requires PJM to establish clear rules for co-located AI data centers. These are post-hoc responses to a constraint that has been building for three years.
The fragmentation observation
The American workaround stack exists because the regulatory structure is layered across federal, state, and local jurisdictions and reacts through executive orders rather than initiates through coordinated industrial policy. FERC governs generator interconnection; states govern load interconnection (until the October 2025 DOE directive); local zoning governs construction permits; transmission infrastructure crosses all three jurisdictions and is structurally underbuilt. The hyperscalers are not solving the grid problem. They are routing around it, building private power islands that the public grid eventually has to interconnect with on terms favourable to the hyperscalers. This is structurally consequential and the consequences flow downstream to consumer electricity bills.

Jackery Solar Generator 1000 v2 with 200W Solar Panel,1070Wh Portable Power Station LiFePO4 Battery,1500W AC/100W USB-C Output, 1Hr Fast Charge for Outdoor,Off-Grid Living,RV,Emergency
- Powerful AC Output: 1500W continuous, 3000W surge
- Lightweight and Portable: Only 23.8 lbs with foldable handle
- Fast Charging: 0-100% in 1 hour via app
As an affiliate, we earn on qualifying purchases.
As an affiliate, we earn on qualifying purchases.
III · The Chinese build · centralised mandate at infrastructure scale
The state-structure crystallization. China’s AI data center build operates from a different constitutional foundation, and the difference shows up at every layer of the stack.
The Eastern Data Western Compute initiative
The empirical signature: launched by the National Development and Reform Commission (NDRC) in February 2022, the “东数西算” project designates eight national computing hubs (four eastern, four western) connected by 10 data center cluster sites routing eastern AI demand to western renewable generation. Western hubs are co-located with renewable resources: Gui’an (Guizhou), Zhongwei (Ningxia), Hohhot (Inner Mongolia), Gansu, Sichuan — all rich in wind, solar, or hydropower.
The PUE mandate: large data centers in China must hit PUE ≤ 1.25 by 2025, compared to Germany’s 1.5 target for 2027. PUE (Power Usage Effectiveness) measures how much of the power drawn at the meter actually reaches compute (lower is better, 1.0 theoretical perfect). The Chinese PUE target is structurally tighter than the Western equivalent, and is enforced by NDRC-aligned subsidies and permitting.
The computing-power targets: 2022 total Chinese computing power was 180 EFLOPS (22% intelligent). The 2025 target is 300 EFLOPS with intelligent computing power exceeding 35%, plus 50 intelligent computing centers distributed across the hubs. The Shaoguang cluster in the Greater Bay Area hub alone targets 500,000 standard-sized racks by 2025. 30+ Chinese cities are actively building intelligent computing infrastructure.
The ultra-high-voltage transmission backbone
The empirical scale: as of end-2025, China operates 45 UHV projects (21 AC at 1,000 kV, 24 DC at ±800 kV or higher) with a total transmission length exceeding 40,000 kilometres (roughly 25,000 miles) and cross-regional transmission capacity exceeding 340 GW. The 14th Five-Year Plan (2021–2025) added more than 12,000 km of new UHV DC lines — from 28,000 km to 40,000+ km — across eight major projects spanning 13,600 km and adding 50 GW of cross-regional capacity.
The technical specifications: UHV transmission (1,000 kV AC or ±800 kV DC and above) loses approximately 3% of energy over 2,000 km vs ~15%+ for conventional 500 kV lines. Green electricity from Qinghai Province reaches Henan, 1,500 km away, in 0.005 seconds. Hydropower from Baihetan reaches Jiangsu in 7 milliseconds across the 2,080 km UHV DC line. The Ningxia–Hunan ±800 kV line commissioned October 2025 delivers ≥50% renewable power, 36 billion kWh per year, sourced specifically from desert wind/PV bases. The Xizang–Greater Bay Area UHV under construction stretches 2,681 km with $7.5B investment, traversing the Qinghai-Tibet Plateau.
The 2024 throughput: cross-regional UHV DC channels transmitted approximately 420 billion kWh of clean energy in 2024, a 70% increase from end of the 13th Five-Year Plan period. No other country has the transmission infrastructure to move renewable energy at this volume and distance. The US equivalent (high-voltage DC interties) is fragmented across regional ISOs, with no comparable cross-continental backbone.
The state-coordination observation
Eastern Data Western Compute is industrial policy that the US does not have a direct equivalent of. It is not a permitting framework; it is a coordinated infrastructure mandate that aligns data center siting with renewable generation siting with transmission siting at the national level. The NDRC issues the directive; the NEA implements the energy side; State Grid Corporation of China and China Southern Power Grid build the UHV backbone; Huawei, ZTE, China Telecom, China Mobile, Tencent, and Alibaba build the data centers. The coordination cost in the US — Cleanview, RMI, FERC, DOE, the seven ISOs/RTOs, 50 state utility commissions, the local zoning boards — is non-trivial. In China the coordination cost is the NDRC’s planning meeting.

Power Equipment Hydro Water Turbine Generator Mini Hydroelectric Turbine Generator Low-Speed Hydro Water Wheel Generator
- Water Wheel Generator: Operates with minimal water flow
- Durable Material: Steel construction with corrosion resistance
- Working Principle: Based on traditional waterwheel mechanics
As an affiliate, we earn on qualifying purchases.
As an affiliate, we earn on qualifying purchases.
IV · The renewable side · the asymmetric foundation
The capacity-comparison crystallization. China is not just building data centers and transmission; it is building generation at a scale that has no historical precedent and that the US is not approaching.
The 2025 buildout numbers
Chinese additions: China added more than 430 GW of new wind and solar capacity in 2025 alone, pushing combined installed wind+solar capacity beyond 1.8 TW. Total installed power generation capacity reached 3.89 TW end of 2025, up 16.1% year-on-year. In the first half of 2025 alone, China installed 210 GW of solar plus 50 GW of wind = 260 GW in six months — more than the entire US installed solar base of 121 GW at end of 2024.
US additions: US 2025 additions were 4.9 GW of wind + 25.6 GW of utility-scale solar + 5.5 GW of distributed solar ≈ 36 GW total. China added approximately eight times what the US added in 2025.
The generation share: renewables (wind + solar + hydro) now exceed 60% of China’s total installed power generation capacity. Wind and solar combined surpassed coal in installed capacity in early 2025. Chinese renewable generation reached approximately 4 trillion kWh in 2025 — exceeding the entire 27-country European Union’s combined electricity consumption (3.8 trillion kWh).
The pipeline: as of December 2025, China accounts for more than 1.5 TW of prospective wind and utility-scale solar capacity in the pipeline — roughly matching the combined total of the next six countries (Brazil, Australia, India, US, Spain, Philippines). The G7 collectively has approximately 520 GW in pipeline.
The investment-scale signal
China’s 2025 energy infrastructure investment: approximately $500 billion across grids, generation, and energy security projects — described by the NEA as “broad-based” and growing fastest in onshore wind (capex +50% vs 2024). This is approximately the same scale as the four-hyperscaler US AI infrastructure commitment ($650B over 2025+2026), but it is spent on the foundation that AI infrastructure runs on, not on the AI infrastructure itself.
The peak-load reference point
Chinese peak power load 2025: 1.506 TW (set July 16). For context, total US installed electricity generation capacity is approximately 1.3 TW. China’s single-day peak load is now higher than the total US installed capacity.
The asymmetric-foundation observation
The Chinese AI data center build sits on top of a renewable generation buildout that operates at roughly an order of magnitude higher pace than the US equivalent. This is the structural foundation everything else in the Chinese AI infrastructure stack rests on. When western Chinese hubs (Inner Mongolia, Gansu, Ningxia) site new AI data centers, they are siting them adjacent to wind and solar farms that generated 4 trillion kWh in 2025 and are projected to grow at 400–500 GW/year. The data centers are not competing with residential demand for grid capacity; they are co-located with surplus generation that the UHV network is designed to evacuate.

Smart Battery Management for Large Scale Energy Storage Systems
As an affiliate, we earn on qualifying purchases.
As an affiliate, we earn on qualifying purchases.
V · The chip-versus-power trade-off · why “less performant” doesn’t mean less capable at system scale
The asymmetric-substitution crystallization. The chip gap is real and well-documented. The structural question is whether the chip gap matters when the power side is structurally different. Empirically, the answer is more complicated than the per-chip comparison suggests.
The export-control posture
Banned to China since 2022: NVIDIA A100, H100, H200, B200, GB200 (the frontier chips US labs use).
Restricted but partially allowed (2025–2026): H20 (degraded H100 for China — capped interconnect bandwidth, lower memory bandwidth). H800/A800 (capped-interconnect versions of H100/A100). The proposed B30A (Blackwell variant for China) is in active US export-policy debate.
The 2024 procurement signal: Chinese companies bought roughly 1 million NVIDIA H20 chips versus an estimated 450,000 Huawei Ascend 910B chips. Chinese AI developers strongly prefer NVIDIA hardware even degraded, including DeepSeek (V3 trained on H800s) and Moonshot (Kimi K2). Only state-backed firms (iFlytek, SenseTime, China Mobile) have meaningfully trained on Huawei hardware.
The Huawei Ascend stack
Ascend 910C (current generation, ramping production 2025): combines two 910B dies via chiplet integration on SMIC’s 7nm N+2 process. ~128 GB HBM3 memory (older HBM2E in many shipments — two generations behind frontier). 800 TFLOPS FP16, ~781 TFLOPS BF16. Approximately 60% of H100 inference performance per DeepSeek’s own assessment, 80% of H20 memory bandwidth. Lacks native FP8/FP4 support — a meaningful disadvantage on reasoning workloads where lower-precision math significantly improves throughput.
But: per-chip total processing performance per watt (TPP/watt) on the 910B/910C exceeds NVIDIA’s H20 — which the RAND analysis notes is itself worse than NVIDIA’s 2020-era A100 on computational performance and energy efficiency. The H20 is what NVIDIA was allowed to sell into China; Huawei’s domestic chips meet or exceed it on most axes that matter except memory bandwidth.
CloudMatrix 384: Huawei’s system-scale answer — 384 Ascend 910C chips, all-optical networking, ~300 PFLOPS aggregate, novel architecture compensating for per-chip limits. The system competes with NVIDIA H200 systems at scale even where the per-chip comparison favours NVIDIA.
Production scale: Huawei is on track to ship over 1 million Ascend dies in 2025, growing toward 1M Ascend 910C + 1M Ascend 950 in 2026 per CFR analysis. The Ascend 920 (6nm, 900+ TFLOPS BF16) is shipping H2 2025. Ascend 960 (planned Q4 2027) would be the first Huawei chip exceeding H200 performance.
The “throw more watts” substitution
The structural argument: if Chinese chips are 60% as performant per-chip but Chinese power infrastructure can deploy them at 2–3x the density without grid constraint, the system-level capability approaches parity. This is the asymmetric substitution that the per-chip comparison misses.
The DeepSeek demonstration: DeepSeek V3 (released December 2024) and R1 (released January 2025) were trained on degraded NVIDIA hardware (H800s, capped interconnect) at approximately 1/10 the compute cost Western labs spent on comparable models. The lesson was not that DeepSeek had better chips; it was that algorithmic efficiency plus power-throughput substitution can produce frontier-competitive models even with constrained silicon. R2 (expected mid-2026) is reportedly being trained on a mix of H800s and Huawei Ascend 910Cs.
The model-training math: if a Chinese training cluster uses 384 Ascend 910Cs (one CloudMatrix system) at 60% per-chip performance against an NVIDIA-equivalent cluster of ~230 H100s, the system-level FLOPS are roughly comparable. The Chinese system uses more power per unit FLOPS — but the Chinese power side has the capacity headroom, and the US power side does not.
The substitution observation
The US has perf-per-watt advantage; China has watts-without-bound advantage. These are asymmetric substitutes — not the same axis. When the perf-per-watt side is bounded by grid capacity (US) and the watts-without-bound side is bounded by chip-perf limits (China), the binding constraint differs. At the current configuration, the binding constraint on the US AI buildout is power; the binding constraint on the Chinese AI buildout is chip performance. The question is which constraint relaxes faster.
VI · The efficiency question · can chip and model gains close the gap
The forward-shape crystallization. The hopeful version of the US story is that perf-per-watt improvements at the chip layer, the rack layer, and the model layer can close the gigawatt gap through efficiency rather than through grid buildout. The skeptical version is that efficiency gains accrue to both sides equally and therefore don’t reverse the asymmetry.
Chip-level efficiency gains
NVIDIA Blackwell B200 vs H100: roughly 4x training performance per chip with similar power envelope. Blackwell GB200 NVL72 racks operate at 130+ kW per rack with liquid cooling — high density per square foot but the perf/watt improvement at the chip is meaningful. GB300 (announced 2025, shipping 2026) continues the curve.
Custom-silicon trajectory: Google TPU v7, AWS Trainium2, Meta MTIA v2, OpenAI’s Broadcom-partnered “Titan” chip (TSMC 3nm, mass production H2 2026, targeted at 10 GW of Stargate capacity). Custom inference silicon at hyperscalers is consistently improving perf/watt by 30–50% per generation.
Model-level efficiency gains
The empirical pattern: frontier model FLOPS/token has fallen approximately 4–10x per year for comparable-quality outputs. DeepSeek V3 and R1 are the canonical efficiency-frontier examples. Algorithmic improvements (better attention mechanisms, sparser activations, mixture-of-experts at scale, distillation, speculative decoding) have produced larger efficiency gains than chip-level improvements over the same horizon.
The serving-side gain: inference cost per million tokens has fallen approximately 10x per year across frontier models since 2023. This is the gain that makes the “throw more chips at it” Chinese substitution viable: even less-efficient chips produce usable inference economics once the model side has compressed enough.
The gap math
The capacity gap: US current AI buildout pipeline is approximately 50–75 GW of planned data center capacity through 2027. The Chinese pipeline is harder to size precisely but is estimated at 40–60 GW of equivalent intelligent-compute capacity, sitting on top of a 3.89 TW total installed generation base versus the US’s ~1.3 TW. The gigawatt-scale gap is not in AI data center pipeline itself; it is in the power-headroom available to absorb that pipeline without consumer-price spillover.
The efficiency-required-to-close: for US efficiency gains to close the gap structurally, perf-per-watt would need to improve faster than the Chinese power buildout grows. China is adding ~430 GW of new wind+solar annually. The US would need to compress AI workloads onto 60–80% less power within 3–5 years to make the comparison neutral, holding other things equal. This is plausible at the model layer; it is harder at the chip and rack layers.
The accrual problem
Efficiency gains accrue to both sides. Chinese AI labs use the same model-architecture innovations (transformer scaling laws, mixture-of-experts, sparse activations) and increasingly the same custom-silicon design patterns. The Chinese chip stack is moving up the efficiency curve as well — slower than NVIDIA, but in the same direction. Net effect: efficiency gains decelerate the divergence; they don’t reverse it. The US doesn’t catch up on power throughput by being more efficient; it catches up by building more transmission, more generation, and faster interconnection — i.e., by solving the constitutional-fragmentation problem.
VII · The structural reading · what this means for AI industrial policy
The synthesis crystallization. The gigawatt gap is not a technology problem. It is a state-structure problem dressed as a technology problem, and the resolution depends on whether the US can do industrial policy at the layer where industrial policy is required.
The constitutional difference
The US side: federalism distributes regulatory authority across federal (FERC, DOE), state (50 utility commissions, governor-level industrial siting), and local (county zoning, municipal permitting) jurisdictions. The seven ISO/RTOs add a quasi-federal coordination layer. Resolution mechanisms run through executive orders, FERC rulemakings, state legislation, and court challenges — each operating on multi-year timelines. The DOE’s October 2025 Section 403 letter to FERC, the December 2025 FERC PJM co-location order, and the April 2026 FERC final-rule deadline are the current visible activity. None of these is industrial policy at the scale the gigawatt gap requires.
The Chinese side: NDRC issues five-year-plan directives; NEA implements the energy side; State Grid and China Southern Power Grid build the transmission backbone under unified mandate; provincial governments execute siting and permitting under hub designation. The coordination cost is internal to the central state apparatus rather than distributed across competing jurisdictional layers. This produces speed and scale at the cost of local accountability and democratic legitimacy. Both costs are real.
The forward paths
Path 1 · Statutory acceleration: Congress passes legislation that grants FERC clear jurisdiction over large-load interconnection, mandates transmission build at federal level, and provides streamlined permitting for AI-relevant infrastructure. This would close the constitutional gap directly. It is not on the legislative agenda in any serious form as of mid-2026.
Path 2 · Permanent behind-the-meter routing: hyperscalers permanently route around the public grid by building private power islands at every major site. This relieves the immediate pressure but produces structural distortions — consumer electricity prices rise as utilities recover stranded costs, local communities bear the externalities, and the public grid remains undermaintained for the broader economy. This is the current trajectory.
Path 3 · International compute distribution: hyperscalers route AI workloads to locations with more permissive power infrastructure — Norway (Stargate), UAE (Stargate), India (OpenAI–Tata), South Korea, Argentina. This eases the domestic constraint but moves AI workload offshore, with strategic and economic consequences. Already happening.
Path 4 · Efficiency-led closing: the US closes the gap through perf-per-watt gains at the chip, rack, and model layers, allowing the same AI capability to operate on less grid capacity. Plausible at the algorithmic layer; harder at the physical-infrastructure layer; partially offset by Chinese efficiency gains in parallel.
The structural-question observation
The gigawatt gap is the open structural question of US AI industrial policy in 2026. It is not a question of who has better chips, better models, or better applications — the US wins all three. It is a question of whether the constitutional structure that governs US energy infrastructure can move at the pace AI infrastructure now requires, and if it cannot, what the consequences are for the layer of AI capability that physically runs everything else.
The honest read: the US AI stack will likely continue to lead on chips, models, and applications through 2028–2030, and the power constraint will produce visible bottlenecks (capacity-market spikes, consumer-price increases, delayed projects) without changing the topline competitive picture. Beyond 2030, the structural difference compounds. China’s renewable buildout continues at 400+ GW/year; the UHV network continues to expand; the chip gap continues to narrow (Ascend 960 in Q4 2027 is projected to exceed H200). The US will not close the gap through efficiency alone. Whether it closes through industrial policy, behind-the-meter routing, or international workload distribution — or whether it doesn’t close — is the question.
There is no single answer. Anyone offering one is selling something. What is unambiguous is that the AI infrastructure debate has not yet caught up to the fact that the binding constraint moved from compute to electricity around 2024, and from electricity to electricity-policy around 2025. Where this lands by 2028 — when the current AI buildout cycle’s capacity targets either materialise or don’t — will determine whether the US AI stack remains globally dominant or whether the gigawatt gap becomes the structural ceiling that the rest of the stack runs into.
That is the structural editorial question the gigawatt gap is sitting on top of. It is constitutional, not technical. It is industrial policy, not engineering. And it is the layer of the AI race the US is not currently winning.
About the Author
Thorsten Meyer is a Munich-based futurist, post-labor economist, and recipient of OpenAI’s 10 Billion Token Award. He spent two decades managing €1B+ portfolios in enterprise ICT before deciding that writing about the transition was more useful than managing quarterly slides through it. He runs StrongMocha News Group, a network of more than 450 niche WordPress magazines built on the DojoClaw editorial engine. More at ThorstenMeyerAI.com.
Related Reading · the AI energy & infrastructure dispatches
This dispatch
- This piece · The gigawatt gap · structural-economics comparison of US and Chinese AI energy stacks at the scale frontier AI deployments now require · structural-slate register
Forthcoming · the AI energy & infrastructure track
- Forthcoming · The behind-the-meter decade · a deeper forensic on the US hyperscaler workaround stack (nuclear restarts, on-site gas, ERCOT arbitrage, the Three Mile Island deal in detail) · empirical-clay register
- Forthcoming · The UHV century · how China’s 40,000+ km transmission backbone was built, and what it cost in democratic legitimacy and local displacement · transition-bronze register
- Forthcoming · The export-control trap · whether US chip restrictions actually slow Chinese AI or accelerate the substitution toward domestic silicon · labor-rose register
- Forthcoming · The grid is industrial policy · the synthesis on what AI infrastructure means for US statutory reform of energy regulation · synthesis-deep register
Adjacent tracks
- Post-Wire Piece 01 · The death of the identical paragraph · structural-economics on the wire’s collapse · adjacent infrastructure-industrial-policy track
- Read the world, then publish · Inside the DojoClaw + Stenvrik loop · operator-side technical account of one specific AI infrastructure piece
Sources
US AI data center buildout · capacity and pipeline
- Data Center Knowledge · Hyperscalers in 2026 · Meta Hyperion 5 GW Louisiana, Prometheus Ohio 1 GW, AWS Indiana 2.2 GW, Microsoft Wisconsin 1.5 GW · global hyperscale pipeline 770 facilities · 1,297 operational as of late 2025 · capex projected >$600B in 2026
- Data Center Frontier · Scaling Stargate · five new US sites announced September 2025 · cumulative ~7 GW planned · path to 10 GW by end-2025
- OpenAI · Five new Stargate sites announcement · $400B+ investment over three years · Shackelford TX · Doña Ana NM · Lordstown OH · Milam TX · Saline Township MI
- IEEE Spectrum · 5 GW data center buildout · Meta Hyperion 5 GW across 11 buildings · xAI Colossus 2 trucked gas turbines · gas turbine wait times up to 7 years
- DCD · Building Stargate · OpenAI Brad Heyde “sweet spot 1–2 GW for training” · Abilene 1.2 GW phase 1 operational September 2025 · 450,000+ NVIDIA GB200 GPUs
- Tech-Insider · AI Data Centers 1,000 TWh by 2026 · AWS plans 3 GW → 12 GW quadrupling · Microsoft acknowledges turning away customers due to power shortages · Meta Hyperion $3.2B gas plant with $550M shouldered by Louisiana residents
- Tech-Insider · US AI Data Center Delays 2026 · 7 GW shortfall 2026 · only ⅓ of announced 2026 capacity has broken ground · transformer manufacturing shortage 15,000 workers
- Distilled.earth · These Data Centers Are Getting Really Big · Stargate vs El Paso Electric (1.2 GW vs 2.4 GW utility peak) · Cleanview tracker 550 planned data centers / 125 GW total capacity
- IntuitionLabs · OpenAI’s Stargate Project · $500B / 10 GW commitment · SoftBank $41B investment · NVIDIA $100B GPU commitment
US grid bottleneck and regulatory response
- RMI · Interconnection Queue · 2,300 GW in queue · 5-year average wait · FERC Order 2023 reforms · interconnection cost uncertainty driver
- Novogradac · Resolving Interconnection Queue Bottleneck · PJM capacity prices $29/MW-day → $329/MW-day cap · 22% rise · 150 GW additional capacity needed by 2030
- Hanwha · Data Center Grid Limitations · 10,300 projects / 1,400 GW + 890 GW storage in queue · only 13% of 2000-2019 requests reached commercial operation by end 2024
- ENR · FERC Weighs Federal Oversight · DOE Section 403 letter October 23 2025 · 20 MW threshold proposed · FERC Chair Swett quote “most important and pressing problem”
- Orrick · FERC Grapples with Data Center Demands · December 18 2025 FERC PJM co-location order · April 30 2026 final-rule deadline · SPP HILL-HILLGA proposal · PJM 2028/2029 base capacity auction June 2026
- White & Case · DOE directs FERC · DOE Section 403 letter · co-located load + generation interconnection · joint filing pathway · diesel generator permitting limits
- Sustainability Dialogue · Interconnection Queue Backlog · IEA estimate: data centers nearly half of US electricity demand growth to 2030 · Texas HB 1500 · ERCOT cost cap
- LBNL · Queued Up 2025 · ~10,300 projects / 1,400 GW generation + 890 GW storage · interconnection through 2024 · withdrawal rates
- Technostatecraft · Federal Power Grab to Fast-Track AI · FERC Chair Laura Swett positioning · December 18 2025 PJM tariff order · Constellation complaint
- ITIF · United States Needs Data Centers · three US interconnections (Eastern, Western, ERCOT) · seven ISOs/RTOs · two-thirds RTO-served · FERC and state regulatory split
US behind-the-meter and workaround stack
- Tech-Insider · AI Data Center Power Crisis · Cleanview February 2026: 30% of new capacity from on-site generation, up from ~0 in early 2025 · projected 50% · Microsoft–Chevron arrangement · capacity certainty above cost savings
- IEEE Spectrum · 5 GW buildout · Stargate Abilene 300 MW on-site gas · xAI Colossus 2 trucked gas turbines · simple-cycle vs combined-cycle efficiency
- ENR · FERC Federal Oversight · onsite gas generation +1,800% since 2025 · small-scale solar +500% · energy storage +70%
China renewable buildout · 2025 capacity and growth
- Carbon Credits · China Adds 8x More Power than US in 2025 · total installed capacity 3.89 TW end 2025 · +16.1% YoY · 430+ GW new wind+solar · $500B 2025 energy investment · onshore wind capex +50% vs 2024
- Gov.cn · Renewables >60% of China Power Capacity 2025 · NEA data · renewable generation ~4 trillion kWh exceeds EU-27 consumption 3.8 trillion kWh
- EIA · China Solar Capacity 2024 · 277 GW utility-scale solar added 2024 alone · 880 GW total utility-scale solar end 2024 · vs 121 GW US installed base
- WEF · China Adds More Renewables Than Any Other · 360 GW wind+solar 2024 · 1.4 TW installed · 366 TWh new renewable generation
- Ember · China Energy Transition Review 2025 · capacity doubled 635 GW → 1,408 GW in three years to 2024 · early 2025 wind+solar overtook coal · battery deployment tripled
- Global Energy Monitor · G7 Gap 2025 · China 1.5+ TW prospective wind+solar pipeline · vs combined Brazil/Australia/India/US/Spain/Philippines · 489 GW distributed solar
- Renewable Energy Industry · China Surpasses 1,000 GW Solar · H1 2025 210 GW solar + 50 GW wind = 260 GW in six months · doubled vs H1 2024
- Gov.cn · Renewables Capacity Doubles H1 2025 · peak power load 1.506 TW July 16 2025 · electricity demand growth 5–6%
China UHV transmission infrastructure
- People’s Daily · 45 UHV Projects in Operation · 21 AC + 24 DC · 40,000+ km · 340 GW cross-regional capacity · 14th Five-Year Plan additions
- Global Energy Monitor · UHV Power Transmission China · 45 lines operational end 2025 · phase history 2009 → present · technical thresholds (1,000 kV AC, ±800 kV DC)
- Wikipedia · UHV Electricity Transmission China · State Grid Corporation 600B RMB investment · 12th Five-Year Plan UHV corridor framework
- Our China Story · UHV Project · 40,000+ km total · 30 trillion kWh cumulative transmission · 0.005 second Qinghai→Henan delivery · 1,500 km
- SCIO · Xizang to Greater Bay Area UHV · 2,681 km · $7.5B investment · ±800 kV DC · September 2025 construction start
- People’s Daily · World’s Highest UHVDC Jinsha-Hubei · 1,901 km · Qinghai-Tibet plateau · 40B kWh/yr clean energy · 4,058 m construction altitude
- Enghunan.gov · 45 UHV Projects in Operation · Baihetan-Jiangsu 2,080 km · Gansu-Shandong 915 km · Ningxia-Hunan ±800 kV October 2025 commissioning · 420 billion kWh cross-regional clean energy 2024
Eastern Data Western Compute and Chinese data center policy
- Premia Partners · East Data West Computing Initiative · NDRC February 2022 launch · 180 EFLOPS 2022 / 300 EFLOPS 2025 target · 50 intelligent computing centers · 30+ cities building
- Sinocities Substack · How is China’s Eastern Data Western Compute Developing · eight national hubs · 10 cluster sites · Gui’an Tencent/Apple/Huawei cluster
- Next Market Insights · China Data Center Market · Gui’an / Zhongwei / Hohhot western hubs · UHV transmission alignment · PUE 1.2 targets · state subsidies
- Root Access Substack · Eastern Data Western Computing · NDRC project framing · Shaoguang cluster 500,000 racks by 2025 · Huawei IP network solution
- Carbon Brief · China Managing Data Center Energy Demand · PUE 1.25 by 2025 mandate · vs Germany 1.5 by 2027
- ScienceDirect · Eastern Data Western Computing Net-Zero · 332-942 GWh annual energy savings · 361 Mt CO2e cumulative reduction by 2030
- ACT Group · China 2025 GEC Policy · large-scale data center PUE ≤ 1.25 · Inner Mongolia / Gansu renewable-rich regions
Chinese AI chip stack and export controls
- Council on Foreign Relations · China’s AI Chip Deficit · Ascend 910C 60% H100 inference perf (DeepSeek estimate) · 80% TPP · production trajectory 400K (2025) → 1M (2026) → 2M (2027) · Ascend 960 Q4 2027 first to exceed H200
- RAND · Leashing Chinese AI Needs Smart Chip Controls · 910B/910C TPP/watt exceeds H20 · H20 worse than 2020 A100 on perf and efficiency · CloudMatrix 384 all-optical networking · 2024 Chinese demand: 1M H20 + 450K Ascend 910B
- IEEE ComSoc Technology Blog · H20 Export Controls Enable Ascend 910C · Paul Triolo analysis · Sophgo TSMC die procurement · Baidu Kunlun · Alibaba Hanguang 800 · Biren BR100 · Moore Threads MTT KUAE
- DCD · Huawei Ascend 920 Announcement · 6nm process · 900+ TFLOPS BF16 · 4 Tbps memory bandwidth · CloudMatrix CM384 launch · 910C mass shipping May 2025
- Versus · NVIDIA vs Huawei AI Chip Wars · 910B beats H200 on tokens-per-watt above 4k sequence length · CloudMatrix-Infer framework DeepSeek R1 deployment · H800/A800 capped-interconnect China-specific NVIDIA chips
- NexGen Compute · Ascend 910C vs H100 · Da Vinci architecture · SMIC 7nm N+2 · 128 GB HBM3 · 800 TFLOPS FP16 · 1600 TOPS INT8 · MindSpore + CANN framework
- SemiAnalysis · Huawei Ascend Production Ramp · TSMC die bank ~2.9M dies · SMIC capacity 1M 910C + 500K 910B in 2025 · HBM bottleneck · CXMT DRAM progress
- Foreign Policy · Leashing Chinese AI · Pangu open-source models · Huawei second-largest China cloud provider · 20% China cloud market share
Key Piece reference figures crystallized
- Frontier AI scale: 100 MW starter / 1–2 GW campus sweet spot / 5 GW Meta Hyperion / 7–12 GW Stargate + AWS multi-year targets
- US grid bottleneck: 2,300 GW interconnection queue · 5-year average wait · PJM capacity prices $29 → $329/MW-day · 30% of new capacity behind-the-meter / on-site generation
- China power scale: 3.89 TW total installed capacity · 1.8 TW wind+solar · 430 GW added 2025 · 4 trillion kWh renewable generation 2025 (> EU-27 total consumption)
- China UHV: 45 projects · 40,000+ km (~25,000 miles) · 340 GW cross-regional capacity · 420B kWh clean energy moved 2024
- Chinese chips: 910C ~60% H100 inference · 1M+ Huawei dies in 2025 · CloudMatrix 384 ~300 PFLOPS · Ascend 960 Q4 2027 projected H200-comparable
- Asymmetric substitution: US perf/watt advantage · China watts-without-bound advantage · binding constraint = power (US) vs. chip-perf (China)
- Constitutional difference: US federal/state/local fragmentation · 7 ISOs/RTOs · executive-order-reactive vs. NDRC + NEA + State Grid centralised mandate