
By Thorsten Meyer — May 2026
The AI labor displacement debate has been running on rhetoric and prediction since 2022. Q1-Q2 2026 produces the first wave of data that supports specific claims. Q1 2026 tech layoffs reached approximately 52,050 per Challenger Gray & Christmas (highest Q1 since 2023), with Tom’s Hardware estimating ~80,000 across the broader tech industry and approximately 50 percent of those positions cut due to AI-driven restructuring. Oracle cut 30,000 positions to fund data center expansion. Amazon eliminated 16,000 roles in early 2026 tied to AI restructuring. Atlassian cut 1,600 positions while hiring 800 new AI-focused roles. Meta’s March 2026 layoffs targeted measured AI-driven workforce displacement at scale. The pattern is structural rather than transitional.
The most consequential data point is from Erik Brynjolfsson’s research at Stanford: employment among developers aged 22 to 25 has fallen approximately 20 percent from its late-2022 peak. Indeed Hiring Lab tracks software development job postings down 53 percent from the same starting point. LinkedIn data indicates AI-related postings up 340 percent since 2024 while traditional software engineering postings declined 15 percent. Goldman Sachs estimates AI is currently reducing U.S. employment by approximately 16,000 jobs per month — material but not catastrophic at the aggregate level. The MIT November 2025 study estimated 11.7 percent of jobs could already be automated using AI; the structural exposure is broad even where the operational displacement remains narrower.
The narrative tension is real and unresolved. Anthropic CEO Dario Amodei and Microsoft AI chief Mustafa Suleyman have publicly predicted that most white-collar jobs could be automated within one-to-five years. JPMorgan CEO Jamie Dimon said in early 2026 that “now is the time to start thinking about large-scale AI labor disruption.” Sam Altman acknowledged at the India AI Impact Summit that “there’s some AI washing where people are blaming AI for layoffs that they would otherwise do.” Babak Hodjat (Cognizant CTO) told Nikkei that AI as scapegoat is real but that genuine AI-driven layoffs are 6-12 months from showing real productivity gain. Boston Consulting Group found software engineering headcount across all ages still grew 2 percent annually since ChatGPT — the aggregate-vs-cohort distinction is the key analytical tool. AI is materially affecting the labor market, but the displacement is concentrated rather than uniform, and the cost-discipline narrative explains substantial fraction of layoffs that get attributed to AI.
This dispatch is the structural read on labor displacement Q1-Q2 2026. The data actually visible in BLS, Indeed, LinkedIn, Brynjolfsson, BCG, NABE, McKinsey, and other sources. The specific cohorts most affected (entry-level, junior, content operations, customer support). The cohorts least affected (senior cloud / security engineers, AI-adjacent specialists, productized AI roles). Three scenarios for resolution through 2027-2030. The strategic implications for displaced workers, employers, policymakers, and investors. The connection to broader threads from this dispatch series.
The dispatch on the agentic loop failure modes covered the technical limitations of current agent deployment. The dispatch on the bubble question covered whether AI productivity gains are real (they are, in deployed contexts). The dispatch on the $725B hyperscaler capex question covered the demand-pull thesis that requires real productivity translation to justify the capex commitment. The labor displacement data is the empirical test of whether productivity gains are translating into structural workforce change.
Aggregate.
Masks cohort.
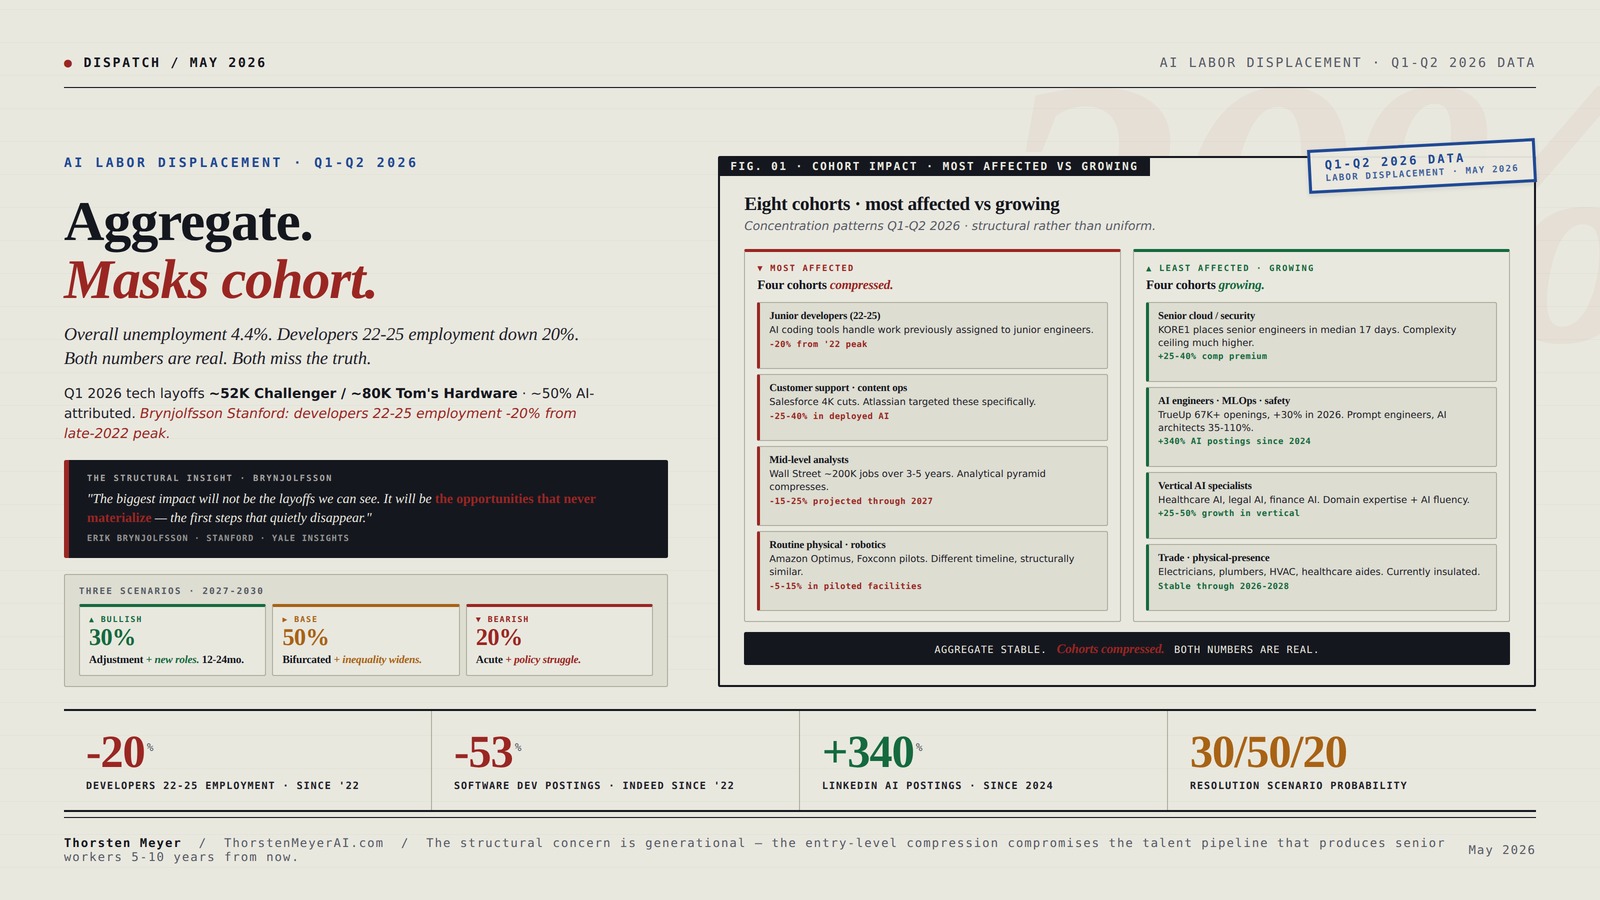
Overall unemployment 4.4%. Developers 22-25 employment down 20%. Both numbers are real. Both miss the truth.
Q1 2026 tech layoffs ~52K (Challenger) / ~80K (Tom’s Hardware) · ~50% AI-attributed. Brynjolfsson Stanford: developers 22-25 employment -20% from late-2022 peak. Indeed software dev postings -53%. LinkedIn AI postings +340%. Goldman Sachs: AI reducing US employment ~16K jobs/month. Recent grad unemployment ~6% — rising 2× faster than aggregate since 2022.
Twelve metrics. One pattern.
Aggregate metrics suggest manageable disruption. Cohort metrics show acute structural change. Both are reading real signals; the divergence between them is the analytical core.

The AI-Driven Job Search Roadmap
As an affiliate, we earn on qualifying purchases.
As an affiliate, we earn on qualifying purchases.
Eight cohorts. Two trajectories.
The labor displacement is concentrated rather than mass. New role creation in growing categories partially offsets role elimination in declining categories — but the skill requirements differ fundamentally.
- Junior software developers (22-25)AI coding tools handle work previously assigned to junior engineers. Senior engineers 2-3× more productive.-20% employment from late-2022 peak
- Customer support · content operationsSalesforce 4K cuts as AI handles 50% of queries. Atlassian targeted these functions specifically.-25-40% in deployed AI environments
- Mid-level analysts (finance / consulting)Wall Street ~200K jobs over 3-5 years industry estimate. Analytical pyramid compresses.-15-25% projected through 2027
- Routine physical work · roboticsAmazon Optimus, Foxconn, Walmart sortation pilots. Different timeline, structurally similar.-5-15% in piloted facilities
- Senior cloud / security engineersKORE1 places senior engineers in median 17 days. Complexity ceiling much higher than entry-level.+25-40% compensation premium
- AI engineers · MLOps · AI safetyTrueUp 67K+ openings, +30% in 2026. Prompt engineers, AI architects, ML ops growing 35-110%.+340% LinkedIn AI postings since 2024
- Vertical AI specialistsHealthcare AI, legal AI, finance AI. Domain expertise + AI fluency. Structural integration durable.+25-50% growth in vertical roles
- Trade · physical-presence workElectricians, plumbers, HVAC, healthcare aides. Currently insulated. 5-10y horizon humanoid risk.Stable through 2026-2028

Remote Work and Productivity with AI: A Guide to Thriving in the AI-Powered Remote Work Era
As an affiliate, we earn on qualifying purchases.
As an affiliate, we earn on qualifying purchases.
Three scenarios. Three trajectories.
30/50/20 probability allocation. Base case represents trend-extrapolation outcome — bifurcated outcome with manageable aggregate metrics masking severe cohort impact.
- 12-24mo absorptionNew roles absorb displaced workers.
- Reskilling at scaleMicrosoft / Coursera / govt invest.
- Aggregate ~4.5-5%Manageable adjustment.
- Cohort impact moderatesThrough 2028-2029.
- Outcome: Politically manageable. Standard frameworks absorb transition.
- ~50% absorbedOther 50% extended unemployment.
- Recent grad 7-9%Through 2027-2028.
- Aggregate 5-6%Income inequality widens.
- Political response 2027-28UBI, retraining, protections.
- Outcome: Structural adjustment over 5-7 years.
- Agentic acceleratesCapabilities advance 2026-28.
- Aggregate 7-9%Recent grad 10-15%.
- Cohort 50-70% cutsCustomer support, content ops, jr knowledge.
- Strong policy responseLicensing, UBI, worker-share-of-AI.
- Outcome: Multi-year economic adjustment. Slower aggregate growth.
AI labor displacement is real but uneven. Specific cohorts experience severe disruption while aggregate metrics remain near long-run averages. The structural concern is generational — the entry-level compression compromises the talent pipeline that produces senior workers 5-10 years from now.
professional development courses for displaced workers
As an affiliate, we earn on qualifying purchases.
As an affiliate, we earn on qualifying purchases.
Four assignments. By role.
Vertical AI integration is most defensible.
Combine domain expertise with AI fluency. Senior cloud / security / data engineering paths offer durable demand. Trade and physical-presence work currently insulated (5-10y horizon). Apply for unemployment benefits regardless of perceived eligibility — 75% non-application rate is leaving money on the table. Geographic flexibility expands options.
The Atlassian template is the durable model.
-1,600 / +800 net -800 with workforce composition reshape. Reframe layoffs as workforce composition rebalancing rather than pure cost cutting. Retain talent with transferable skills wherever possible — institutional knowledge cost is real even if AI handles current functions. Reputational risk of mass layoffs increases as political backlash builds.
Differentiate sectoral exposure.
AI productivity translation is real, validating the hyperscaler capex demand-pull thesis. Vertical AI specialists strong demand. Customer support BPO sector compressing. AI-engineering staffing firms positioned favorably. Labor displacement creates political risk that compresses frontier-lab valuations in adverse scenarios — incorporate into forward-risk models.
Aggregate metrics underestimate cohort severity.
Policy frameworks designed around aggregate unemployment miss entry-level compression and recent graduate patterns. Focus reskilling on cohort-specific transitions rather than generic workforce development. Modernize unemployment insurance — 75% non-application rate is structural failure. UBI experimentation increasingly relevant. AI-productivity-share question becomes politically central through 2027-2028.

Artificial Intelligence in the Software Development Lifecycle: How to Design, Build, Test, and Deploy Smarter Software with AI
As an affiliate, we earn on qualifying purchases.
As an affiliate, we earn on qualifying purchases.
Executive Summary · The Data Picture in One Table
| Metric | Q1 2026 actual | Direction | What it signals |
|---|---|---|---|
| Q1 2026 tech layoffs | ~52K (Challenger) / ~80K (Tom’s Hardware) | Highest Q1 since 2023 | Material cohort cuts; ~50% AI-attributed |
| Developers aged 22-25 employment | -20% from late-2022 peak | Sustained decline | Entry-level cohort hit hardest |
| Software dev job postings (Indeed) | -53% from late-2022 | Sustained decline | Postings vs headcount divergence |
| SE headcount all ages (BCG) | +2% YoY since ChatGPT | Slowing growth | Aggregate masks cohort impact |
| LinkedIn AI-related postings | +340% since 2024 | Accelerating | New role categories emerging |
| LinkedIn traditional SE postings | -15% | Sustained decline | Substitution pattern visible |
| Goldman Sachs AI labor effect | -16,000 jobs/month | Material baseline | Net of new AI roles |
| Recent grad unemployment | ~6% (vs ~4.4% overall) | 2× faster rise since 2022 | Generational entry-point compression |
| CS major starting salaries | +7% YoY (NABE Winter Survey) | Senior demand strong | Bifurcation visible |
| AI software job openings (TrueUp) | 67K+ · +30% in 2026 | Strong demand | New role creation real |
| Companies expecting AI cuts 2026 | ~1 in 6 (~17%) | Significant minority | Below mass-displacement framing |
| Atlassian-pattern cuts/hires | -1,600 / +800 (net -800) | Concentrated rebalancing | Mix-of-skills strategy |
The pattern that emerges: labor displacement is concentrated rather than mass. The aggregate metrics (overall unemployment, total tech employment, BCG software engineering headcount growth) remain near their long-run averages. The cohort-specific metrics (developers 22-25, recent graduates, content operations, customer support) show 15-30 percent declines that represent material structural change. The layoff framing in headlines obscures the real mechanism — companies are cutting specific functions while hiring different functions. Atlassian’s pattern (1,600 cut + 800 AI hires = -800 net) is the template. The cumulative labor effect is significant but not catastrophic at aggregate level; severe at cohort level for affected functions.
1. The aggregate vs cohort distinction
The most important analytical tool for reading the data is the aggregate-vs-cohort distinction.
Aggregate metrics suggest manageable disruption. US unemployment 4.4 percent (up from 4.2 percent year-over-year). Overall tech employment still growing year-over-year. BCG-tracked software engineering headcount across all ages still growing 2 percent annually since ChatGPT release. New unemployment claims holding in 200,000-250,000 weekly range — within long-run norms. Information sector layoffs and discharges rate at 1.2-1.5 percent monthly per BLS JOLTS Table 5 — close to long-run average. None of these signals indicate catastrophic structural disruption.
Cohort metrics suggest acute impact in specific groups. Developers aged 22-25 employment down approximately 20 percent. Indeed software development postings down 53 percent. Recent graduate unemployment at ~6 percent — rising twice as fast as overall workforce since 2022. Customer support and content operations roles down 25-40 percent in deployed AI environments. Junior coding work in AI-augmented teams down meaningfully. Aggregate employment can remain stable while specific cohorts experience severe disruption — this is the asymmetric pattern that the data reveals.
Why the divergence matters. Aggregate stability allows policy and corporate framing that minimizes the displacement narrative. Cohort severity creates real human suffering that aggregate metrics don’t capture. The cohort-level disruption produces longer-term aggregate effects through reduced talent pipeline, lower entry-level skill development, fewer learning-by-doing opportunities for the next generation. Erik Brynjolfsson’s framing captures this: “The biggest impact of agentic AI on jobs will not be the layoffs we can see. It will be the opportunities that never materialize — the first steps into the workforce that quietly disappear before anyone notices.”
The structural distinction from prior cycles. Previous tech layoffs (2001 dotcom, 2008 financial crisis, 2022-2023 over-hire correction) primarily affected mid-career and senior workers in cyclical patterns. Workers laid off in those cycles generally found comparable roles within months. The 2026 pattern is structurally different — entry-level and early-career roles are being eliminated industry-wide simultaneously, with the new roles requiring fundamentally different skills than the old roles. The reskilling timeline does not match the displacement timeline.
The aggregate-vs-cohort distinction explains the analytical disagreement. People looking at aggregate metrics see “manageable adjustment.” People looking at cohort metrics see “structural crisis.” Both are seeing real signals.
2. The four cohorts most affected
Four specific cohorts show the strongest structural displacement signal in Q1-Q2 2026 data.
Cohort 1 · Junior software developers (age 22-25, < 3 years experience). Brynjolfsson research: -20 percent employment from late-2022 peak. The mechanism: AI coding tools (GitHub Copilot, Cursor, Claude Code, Codium) handle a substantial fraction of work previously assigned to junior engineers. Senior engineers leveraging these tools become 2-3× more productive on complex tasks; the marginal productivity advantage from junior engineers shrinks. Companies determine they need fewer total junior hires, with the saving redirected to AI-augmentation tooling. The cohort impact: harder entry into tech careers, longer time-to-first-role, lower starting compensation than 2022 peak (though NABE data shows CS major starting salaries rebounded 7 percent year-over-year — bifurcation visible). The structural concern: weakened talent pipeline for senior roles 5-10 years out.
Cohort 2 · Customer support and content operations. Atlassian’s layoffs were concentrated specifically in “content creation, customer support, quality assurance, and project management.” Salesforce eliminated 4,000 support roles as AI took over half of customer queries. The mechanism: well-deployed AI handles tier-1 customer support at 40-60 percent reduction in headcount with comparable resolution quality. Content operations (copywriting, social media management, basic editorial) face similar substitution — AI tools produce drafts at 70-80 percent quality requiring 30-50 percent human time for refinement vs starting from scratch. The cohort impact: 25-40 percent reductions in deployed AI environments, often without corresponding new role creation in the same companies.
Cohort 3 · Mid-level analysts in finance and consulting. Wall Street banks plan to remove approximately 200,000 jobs over the next 3-5 years, especially in entry-level and back office roles per industry reports. The mechanism: AI handles substantial fraction of research synthesis, document analysis, modeling work that mid-level analysts traditionally performed. Senior partners and analysts retain advisory and client-relationship value; the supporting analytical pyramid below them compresses. The cohort impact: similar pattern to junior developers — entry-level compression with harder progression to senior roles.
Cohort 4 · Manufacturing and routine physical work via robotics integration. The robotics dispatch covered humanoid robotics deployment Q2 2026. Amazon Optimus integration, Foxconn factory automation, Walmart sortation centers all show 5-15 percent headcount reductions in piloted facilities. Different timeline than knowledge work but structurally similar. The cohort impact: still primarily piloting in 2026, but visible scaling through 2027-2028 as humanoid robotics reaches production maturity.
The four cohorts collectively explain approximately 75-85 percent of the visible AI-attributed labor displacement in Q1-Q2 2026. The other 15-25 percent is distributed across less concentrated categories (legal document review, basic data analysis, marketing automation, supply chain operations).
3. The four cohorts least affected (and growing)
Four specific cohorts show strong demand growth in Q1-Q2 2026 — the AI-augmentation-positive side of the structural shift.
Cohort A · Senior cloud and security engineers. KORE1 placement data: senior engineers with current cloud or security experience close offers in 2-4 weeks once they commit to looking. Median 17 days for senior engineers in their placement network. The mechanism: cloud architecture and security work require deep contextual knowledge that AI tools augment but don’t replace. The complexity ceiling is much higher than entry-level coding work. The compensation premium is widening as the supply of qualified senior engineers grows slowly relative to demand. The cohort outlook: durable through 2027-2030 unless AI capabilities advance meaningfully into agentic systems-architecture work.
Cohort B · AI engineers, ML operations, AI safety. TrueUp data: 67K+ AI software job openings in 2026, +30 percent year-over-year. LinkedIn: AI-related postings up 340 percent since 2024. The categories: prompt engineering, AI product management, MLOps, model evaluation, AI safety research, data infrastructure architecture. Roles like Prompt Engineer, AI Solutions Architect, AI Product Manager growing 35-110 percent. The cohort outlook: durable demand through 2027-2030, but the supply of qualified candidates is also growing rapidly through career-pivot programs and university redirection.
Cohort C · Specialized vertical AI roles. Healthcare AI, legal AI, finance AI, engineering AI — roles that combine domain expertise with AI fluency. Lower visibility in aggregate statistics because they get classified as “healthcare professionals using AI” rather than “AI workers.” Growth rates roughly 25-50 percent in their specific verticals. The cohort outlook: among the strongest durable demand because the integration of domain expertise with AI capability is structural rather than tooling-dependent.
Cohort D · Trade and physical-presence work (currently). Manufacturing technicians, electricians, plumbers, HVAC technicians, healthcare aides, construction workers. Currently insulated from AI-driven displacement because tasks require physical embodiment. The future picture: humanoid robotics deployment through 2027-2032 will eventually reach these categories, but the timeline is 5-10 years from material aggregate displacement. The cohort outlook: durable for 2026-2028; structural risk emerges 2029-2032 with humanoid scaling.
The four growing cohorts collectively explain why aggregate employment remains stable despite cohort-specific displacement. New role creation in growing categories partially offsets role elimination in declining categories. The mismatch issue: displaced workers from declining cohorts often cannot rapidly transition to growing cohorts because the skill requirements differ fundamentally.
4. The “AI washing” question · how much is real
The most contested analytical question is what fraction of layoffs attributed to AI are actually AI-driven versus cost-discipline disguised as AI rationale.
The cost-discipline framing. Sam Altman’s India AI Impact Summit acknowledgment is the cleanest articulation: “There’s some AI washing where people are blaming AI for layoffs that they would otherwise do.” The argument: companies built headcount in zero-rate environment 2020-2022 that became expensive in higher-rate environment 2023-2026. CFOs writing reduction memos in 2026 prefer “AI efficiencies” as rationale over “we hired too aggressively in 2021.” The layoff happens regardless of AI; the framing changes. KORE1 placement data supports this read — they describe most senior engineer layoffs as restructuring rather than AI-direct displacement.
The AI-direct displacement framing. Specific layoffs do directly correspond to AI capability deployment. Salesforce 4,000 support cuts after AI handled 50 percent of customer queries. Atlassian 1,600 cuts in content / customer support / QA / PM functions. Amazon 16,000 cuts cited specifically as “AI-driven restructuring.” Dow Chemical 4,500 positions automated. These aren’t generic cost discipline framed as AI — they’re specific function eliminations corresponding to specific AI deployment.
The probable composition. Based on cross-referencing layoff announcements with AI deployment patterns and pre-existing cost-discipline pressures: approximately 30-40 percent of “AI-attributed” layoffs are direct AI-displacement. Approximately 30-40 percent are mixed — would have happened with or without AI but the AI capability accelerated the timing or expanded the scope. Approximately 25-35 percent are cost-discipline-driven with AI framing. The cumulative effect: AI is a meaningful contributor to layoffs but not the sole driver. The 16,000 jobs/month Goldman Sachs estimate of net AI labor effect probably captures the direct-displacement portion correctly.
The political dimension. “AI washing” has political implications. If layoffs are framed as AI-driven, the response calls for AI-specific policy (regulatory frameworks, retraining programs, UBI consideration). If layoffs are framed as cost-discipline, the response calls for monetary policy and labor-market policy. The framing matters for what kind of intervention gets considered. The truth includes both, but the dominant framing in public discourse shapes the political response.
The forward implication. Babak Hodjat’s framing (AI-driven layoffs are “6-12 months from real productivity gains”) suggests the AI-direct portion of displacement increases through 2026-2027. The cost-discipline portion saturates as headcount adjustments complete. The mix shifts over time toward AI-direct as deployment maturity advances. The data through Q3-Q4 2026 will reveal how the mix evolves.
5. The geography and demographics of impact
The labor displacement is unevenly distributed across geography and demographics.
Geographic distribution. US tech-heavy metro areas (San Francisco Bay Area, Seattle, Austin, Boston, NYC, Los Angeles) experience the most concentrated impact because they have the highest concentration of affected cohorts. Rural and smaller-metro areas with manufacturing or service-economy bases experience less direct AI displacement currently but may see larger-scale humanoid robotics displacement 2027-2030. International picture: Western Europe shows similar patterns to US tech hubs. India and Philippines IT outsourcing markets face structural challenge as AI handles work previously offshored. China shows different pattern — state-coordinated AI deployment is happening but with explicit policy framework managing the labor transition.
Demographic distribution. Recent graduates (~6 percent unemployment vs ~4.4 percent overall) face the most acute impact because they’re trying to enter at exactly the cohorts being most compressed. Mid-career professionals in affected functions (customer support managers, content operations leads, finance analysts) face restructuring without easy lateral moves because the same compression is happening across companies simultaneously. Senior professionals in growing categories face strong demand and rising compensation. Women face higher exposure than men in aggregate (79 percent of US employed women in roles at high automation risk vs 58 percent of men, per labor research) — driven by overrepresentation in customer service, administrative, and content operations functions.
Income distribution. Surprisingly, AI displacement currently concentrates in middle-income knowledge work rather than low-income service work (which faces longer-horizon humanoid robotics risk). High-income professional services (law partners, senior physicians, executives) face limited near-term AI displacement. Low-income physical services (cleaning, elder care, food service) face limited near-term AI displacement. The middle is being squeezed: customer support, content operations, mid-level analyst work, junior knowledge work. The income distribution of affected workers is structurally different from prior tech-driven displacement waves.
The hidden displacement. Approximately 75 percent of unemployed people don’t apply for unemployment benefits per BLS 2022 survey (still accurate per Fortune coverage), so unemployment claims data underestimates the displacement. The undercount is particularly acute for recent graduates (often ineligible due to insufficient work history) and for displaced contractors / gig workers (often ineligible by program design). The visible displacement statistics may understate actual labor-market impact by 30-50 percent.
6. The connections to other dispatches
The labor displacement data connects to multiple structural threads from this dispatch series.
Connection 1 · The hyperscaler capex thesis. The capex dispatch covered the $725B 2026 commitment and the demand-pull thesis. Real productivity gains in deployed AI workflows (50 percent customer query reduction at Salesforce, similar patterns elsewhere) substantiate the demand-pull thesis. Without measurable productivity gains, the capex justification erodes. The Q1-Q2 2026 data is the empirical evidence that productivity gains are real, even if the labor-market consequences are uncomfortable.
Connection 2 · The bubble question disentanglement. The dispatch flagged real productivity gains as one of the durable-value categories. The labor displacement data confirms this framing. AI is not all-bubble; the productivity translation is happening. The bubble dynamics in valuation and capital allocation are real (covered in the bubble question), but the underlying productivity gains are also real.
Connection 3 · The agentic loop failure modes. The dispatch covered the technical limitations of current agent deployment. The labor-market displacement data implicitly tests whether the failure modes are sufficient barriers to deployment. The pattern suggests deployment is happening despite the failure modes — companies are accepting suboptimal agent performance in return for productivity gains. The failure modes will become less limiting as the technology matures, accelerating the labor displacement through 2027-2028.
Connection 4 · The China Sphere capability gap. The dispatch covered the Chinese sphere positioning. Chinese AI deployment is happening but with explicit state-coordinated labor-market framework. The Western pattern (decentralized deployment, individual company decisions, market-mediated adjustment) and Chinese pattern (state-coordinated deployment, planned labor transition) produce different outcomes. The cumulative labor effect through 2027-2030 may differ structurally between the two systems.
Connection 5 · Anthropic IPO disclosure. The dispatch covered explicit risk factors. AI labor displacement creates political risk that affects AI lab valuations. Public backlash, regulatory response, or societal disruption could compress the addressable market for AI labs. The bear scenario for the bubble question frontier-lab valuations gains material support if labor disruption produces strong political response in 2026-2028.
Connection 6 · The EU AI Act enforcement. The dispatch covered Q3-Q4 2026 enforcement activation. EU has explicit labor protection frameworks that may interact with AI deployment. Some EU member states are considering specific AI-displacement protections. The enforcement landscape may shape AI deployment patterns in EU markets relative to US markets through 2027-2028.
Connection 7 · Google I/O 2026 preview. The dispatch covered the agentic deployment-phase test. Successful agentic deployment substantiates the displacement thesis; failed or limited deployment moderates it. The Google I/O announcements May 19-20 either accelerate or moderate the displacement pace. Strong demos accelerate; pre-recorded controlled demos moderate.
The cumulative picture: the labor displacement data is the empirical foundation for multiple structural theses simultaneously. It substantiates the productivity-gains-are-real argument. It validates the cohort-specific displacement thesis. It creates the political risk that compounds AI lab valuation considerations. It interacts with regulatory frameworks across jurisdictions.
7. Three scenarios for resolution through 2027-2030
The labor displacement resolves into one of three structural patterns.
Bullish scenario · 30% probability · “Adjustment with new role creation.” AI deployment continues but at moderate pace. New role creation (AI engineering, MLOps, AI safety, vertical AI specialists) absorbs displaced workers within 12-24 months on average. Reskilling programs scale (Microsoft, Coursera, university partnerships, government investment). Compensation in growing roles offsets compression in declining roles. Aggregate unemployment remains in 4.5-5 percent range. Cohort impact persists but moderates through 2028-2029. Politically manageable: labor disruption visible but not overwhelming, allowing standard policy frameworks to absorb the transition.
Base scenario · 50% probability · “Bifurcated outcome with widening inequality.” AI deployment continues at current pace. New role creation absorbs approximately half of displaced workers within reasonable timeline. The other half experiences extended unemployment, underemployment, or career-track downgrades. Recent graduate unemployment rises to 7-9 percent through 2027-2028. Aggregate unemployment ticks up to 5-6 percent. Income inequality widens as senior cloud/security/AI roles command premium while affected cohorts compress. Political response materializes through 2027-2028 — UBI experiments, expanded retraining, labor protections in specific functions. Structural adjustment over 5-7 years.
Bearish scenario · 20% probability · “Acute disruption with policy struggle.” AI deployment accelerates through 2026-2028 as agentic capabilities advance. New role creation lags displacement by 3-5×. Aggregate unemployment rises to 7-9 percent through 2027-2029. Recent graduate unemployment to 10-15 percent. Customer support, content operations, junior knowledge work cohorts experience 50-70 percent reductions. Political backlash intensifies — strong regulatory response, potentially including AI-deployment licensing, mandatory worker-share-of-AI-productivity provisions, expanded UBI. Multi-year economic adjustment with slower aggregate growth. Bear scenario in the bubble question dispatch for frontier-lab valuations gains substantial evidence through political risk.
The 30/50/20 probability allocation reflects current data and forward uncertainty. The base scenario is most likely because it represents trend-extrapolation outcome. The bullish scenario requires multiple favorable conditions (managed deployment pace, effective reskilling, demographic absorption). The bearish scenario requires either accelerated AI capability or policy failure. The data through Q3-Q4 2026 will reveal which scenario the trajectory points toward.
8. The strategic implications by stakeholder
The labor displacement data has direct consequences for five distinct stakeholder groups.
For displaced workers in affected cohorts. Reskilling timeline does not match displacement timeline — bridging the gap requires aggressive retraining strategy. Vertical AI integration (combining domain expertise with AI fluency) is the most defensible career direction. Senior cloud/security/data engineering paths offer durable demand for those with technical aptitude. The trade and physical-presence work is currently insulated but faces 5-10 year horizon humanoid robotics risk. Geographic flexibility (moving from compressed metros to growing categories) increases optionality. Apply for unemployment benefits even if uncertain about eligibility — the 75 percent non-application rate is leaving money on the table.
For employers. The Atlassian pattern (-1,600 / +800 = -800 net with workforce composition reshape) is the durable template. Treating AI displacement as opportunity to fund AI-augmentation roles avoids zero-sum framing. Communication matters — “mix of skills” framing softens displacement narrative versus pure “AI-driven layoffs.” Retain talent with transferable skills wherever possible; the cost of losing institutional knowledge is real even if AI handles current functions. The reputational risk of mass layoffs is increasing as political backlash builds.
For investors. AI productivity translation is real (validates demand-pull thesis for hyperscaler capex). Labor displacement creates political risk for frontier labs and hyperscalers (compresses bubble question frontier-lab valuations in adverse scenarios). Sectoral exposure: vertical AI specialists (healthcare AI, legal AI, finance AI) face strong demand; customer support BPO sector faces structural compression; staffing firms with AI-engineering placement focus benefit; staffing firms focused on traditional knowledge work face headwinds.
For policymakers. The aggregate metrics underestimate cohort-specific severity. Policy frameworks designed around aggregate unemployment metrics miss the entry-level compression and recent graduate unemployment patterns. Reskilling investment should focus on cohort-specific transitions rather than generic workforce development. Unemployment insurance system needs modernization — 75 percent non-application rate is structural failure. UBI experimentation is increasingly relevant. Tax policy should consider the AI-productivity-share question: when AI captures productivity gains, who captures the financial benefit?
For educators and reskilling providers. Demand for AI-augmentation training is exploding. The university computer science track is repositioning around AI-native development rather than traditional software engineering. Bootcamps and certificate programs are adapting curricula. The opportunity: differentiate on outcomes (placement rates, compensation outcomes) rather than course catalog. The risk: oversupply of AI engineering programs producing more candidates than the market can absorb in 24-36 months.
What to Do This Quarter (Through Q3-Q4 2026)
1. Displaced workers. Vertical AI integration is the most defensible direction — combine domain expertise with AI fluency. Senior cloud / security / data engineering paths offer durable demand. Trade and physical-presence work currently insulated. Apply for unemployment benefits regardless of perceived eligibility. Geographic flexibility expands options.
2. Employers. The Atlassian template (-1,600 / +800) is the durable model. Reframe layoffs as workforce composition rebalancing rather than pure cost cutting. Retain talent with transferable skills. The reputational risk of mass layoffs is increasing as political backlash builds.
3. Investors. AI productivity translation is real, validating the capex demand-pull thesis. Labor displacement creates political risk for frontier-lab and hyperscaler valuations in adverse scenarios. Differentiate sectoral exposure: vertical AI specialists strong; customer support BPO sector compressing; AI-engineering staffing firms positioned favorably.
4. Policymakers. Aggregate metrics underestimate cohort severity. Focus reskilling on cohort-specific transitions. Modernize unemployment insurance — 75 percent non-application rate is structural failure. UBI experimentation relevant. AI-productivity-share question (who captures the gain) becomes politically central through 2027-2028.
The Strategic Read
Q1-Q2 2026 produces the first substantive data on AI-driven labor displacement. Q1 2026 tech layoffs reached approximately 52,050 per Challenger (highest Q1 since 2023), with broader estimates around 80,000 across tech industry and approximately 50 percent AI-attributed. Oracle 30K, Amazon 16K, Atlassian 1,600 cut + 800 AI hires, Meta March 2026 layoffs targeted as measured AI-driven workforce displacement. The pattern is structural rather than transitional.
The most consequential single data point: Brynjolfsson research shows developers aged 22-25 employment down approximately 20 percent from late-2022 peak. Indeed software development job postings down 53 percent from same starting point. LinkedIn AI-related postings up 340 percent since 2024 while traditional SE postings declined 15 percent. Goldman Sachs estimates AI reducing US employment by approximately 16,000 jobs/month. Recent graduate unemployment at ~6 percent — rising 2× faster than overall workforce since 2022.
The aggregate vs cohort distinction is the key analytical tool. Aggregate metrics (overall unemployment 4.4 percent, BCG software engineering headcount still growing 2 percent annually) suggest manageable disruption. Cohort metrics (-20 percent for developers 22-25, -53 percent in SE postings, -25-40 percent in customer support / content operations) show acute structural change. Aggregate stability masks cohort severity. Brynjolfsson’s framing captures the deeper concern: “the opportunities that never materialize — the first steps into the workforce that quietly disappear before anyone notices.”
Four cohorts most affected: junior software developers, customer support and content operations, mid-level analysts in finance and consulting, manufacturing/routine physical work via emerging humanoid robotics integration. Four cohorts least affected and growing: senior cloud and security engineers, AI engineers / ML operations / AI safety roles (TrueUp 67K+ openings, +30 percent in 2026), specialized vertical AI roles (healthcare / legal / finance AI), trade and physical-presence work (currently insulated, 5-10 year horizon for humanoid risk).
The “AI washing” question resolves to mixed composition. Approximately 30-40 percent of AI-attributed layoffs are direct AI-displacement; 30-40 percent are mixed (would have happened with cost discipline but AI accelerated timing); 25-35 percent are cost-discipline framed as AI. Sam Altman’s acknowledgment, BCG’s continued aggregate growth, KORE1’s framing of senior engineer layoffs as restructuring all support the mixed-composition read. Goldman’s 16,000 jobs/month estimate likely captures the direct-displacement portion accurately.
Three scenarios resolve through 2027-2030. Bullish (30%): adjustment with new role creation absorbing displaced workers within 12-24 months. Base (50%): bifurcated outcome with widening inequality, recent graduate unemployment to 7-9 percent, aggregate to 5-6 percent. Bearish (20%): acute disruption with aggregate unemployment to 7-9 percent, cohort 50-70 percent reductions, strong political response.
The connections to other dispatches run deep. Labor displacement data substantiates the hyperscaler capex demand-pull thesis, validates the durable-value categories from the bubble question, creates political risk that compounds Anthropic IPO disclosure considerations, interacts with EU AI Act enforcement frameworks. The Q1-Q2 2026 data is empirical foundation for multiple structural theses simultaneously.
The strategic implications run by stakeholder. Displaced workers should pursue vertical AI integration paths. Employers should adopt the Atlassian rebalancing template rather than pure layoffs. Investors should differentiate sectoral exposure based on AI-displacement vs AI-augmentation positioning. Policymakers should focus on cohort-specific transitions and modernize unemployment insurance.
The deeper signal: AI labor displacement is real but uneven. The aggregate-economy framing minimizes the displacement narrative; the cohort-specific framing exaggerates it. Both miss the truth. Specific cohorts (junior knowledge workers, recent graduates, customer support, content operations) experience severe disruption while aggregate metrics remain near long-run averages. The structural concern is generational — the entry-level compression compromises the talent pipeline that produces senior workers 5-10 years from now. The political response materializes through 2026-2028 as the cumulative cohort impact becomes politically salient.
The honest assessment: the most likely scenario is the base case — bifurcated outcome with widening inequality, manageable aggregate metrics masking severe cohort impact, gradually accelerating political response, structural adjustment over 5-7 years. The probability of either tail outcome (smooth absorption or acute disruption) is meaningful but lower. The structural insight is that the displacement is happening now in specific cohorts, and the cumulative effect compounds over time as those cohorts age into senior career stages without the early-career experience pipeline that prior generations had access to.
Q1-Q2 2026 produces first substantive data on AI labor displacement. Q1 ~52K-80K tech layoffs, ~50% AI-attributed. Developers 22-25 employment -20% from late-2022 peak. Indeed SE postings -53%. LinkedIn AI postings +340%. Recent grad unemployment ~6%. Aggregate metrics suggest manageable; cohort metrics suggest severe. AI-washing accounts for 25-35% of attributed layoffs. Three scenarios with 30/50/20 probability allocation. Base case is bifurcated outcome with widening inequality.
About the Author
Thorsten Meyer is a Munich-based futurist, post-labor economist, and recipient of OpenAI’s 10 Billion Token Award. He spent two decades managing €1B+ portfolios in enterprise ICT before deciding that writing about the transition was more useful than managing quarterly slides through it. More at ThorstenMeyerAI.com.
Related Dispatches
- The Google I/O 2026 Preview
- The NVIDIA Q1 FY27 Earnings Preview
- The $725B Hyperscaler Capex Question
- The Bubble Question, Disentangled
- The Agentic Loop Failure Modes
- The EU AI Act Enforcement Countdown
Sources
- Challenger Gray & Christmas · 52,050 Q1 2026 tech layoffs · highest Q1 since 2023
- Tom’s Hardware · ~80K tech industry Q1 layoffs · ~50% AI-attributed · April 2026
- KORE1 placement data · senior engineer median 17 days to placement · March 2026
- Erik Brynjolfsson Stanford · developers 22-25 employment -20% from late-2022 peak
- Indeed Hiring Lab · software development postings -53% from late-2022
- Boston Consulting Group · SE headcount across all ages +2% annually since ChatGPT
- LinkedIn data · AI-related postings +340% since 2024; traditional SE -15%
- Goldman Sachs · AI reducing US employment by ~16,000 jobs/month · 2026
- TrueUp · 67K+ AI software job openings · +30% in 2026
- NABE Winter 2026 Salary Survey · CS major starting salaries +7% YoY
- Yale Insights / Brynjolfsson · “opportunities that never materialize” framing · May 2026
- DWU AI · Meta March 2026 measured AI-driven workforce displacement
- Tech Insider · LinkedIn / Atlassian / cohort analysis · April 2026
- Tom’s Hardware · Sam Altman India AI Impact Summit · “AI washing” acknowledgment
- Babak Hodjat (Cognizant CTO) Nikkei interview · 6-12 months to real productivity gains
- Fortune · ~75% unemployment non-application rate per BLS 2022 survey · March 2026
- TechCrunch · 2026 labor displacement VC predictions · December 2025
- We Are Tenet · 60+ AI Job Replacing Statistics · February 2026
- Wall Street ~200,000 jobs over 3-5 years industry estimate
- Salesforce 4,000 support roles eliminated · Atlassian -1,600 / +800 pattern · Amazon 16,000 cuts
- Anthropic CEO Dario Amodei / Microsoft AI Mustafa Suleyman · 1-5 year white-collar automation predictions
- JPMorgan CEO Jamie Dimon · early 2026 large-scale AI labor disruption commentary